How to configure Azure Monitor Diagnostic settings in the Azure Portal
Learn how to enable Azure Monitor diagnostic settings in the Azure Portal to collect logs and metrics for better monitoring and analysis.

Most Azure resources offer a feature known as an Azure Monitor Diagnostic setting. This setting enables you to define which logs and metrics you want to capture from a resource and specify their destination. You can choose to send this data to Azure Log Analytics, a storage account, an event hub, or even a third-party solution.
In this blog post, I’ll guide you through the steps to enable Azure Monitor diagnostic settings using the Azure Portal.
What Are Azure Monitor Diagnostic Settings?
Nearly all Azure resources include an option called Azure Diagnostics, which allows you to collect and direct logs and metrics from that resource to various locations for monitoring and analysis. The specific logs and metrics available depend on the resource type.
You can send logs and metrics to different destinations, including:
- Log Analytics – For querying and setting up alerts.
- Event Hub – To stream data to external services.
- Storage Account – For long-term data retention.
- Third-party solutions – Such as Splunk or Datadog.
How to configure diagnostic settings in the Azure Portal
Let’s look at how to enable diagnostics settings with the Azure Portal. In this walkthrough, I am going to use an Azure Key Vault, but configuring the setting is the same or similar for all other resources that support this feature.
- Go to Azure Portal
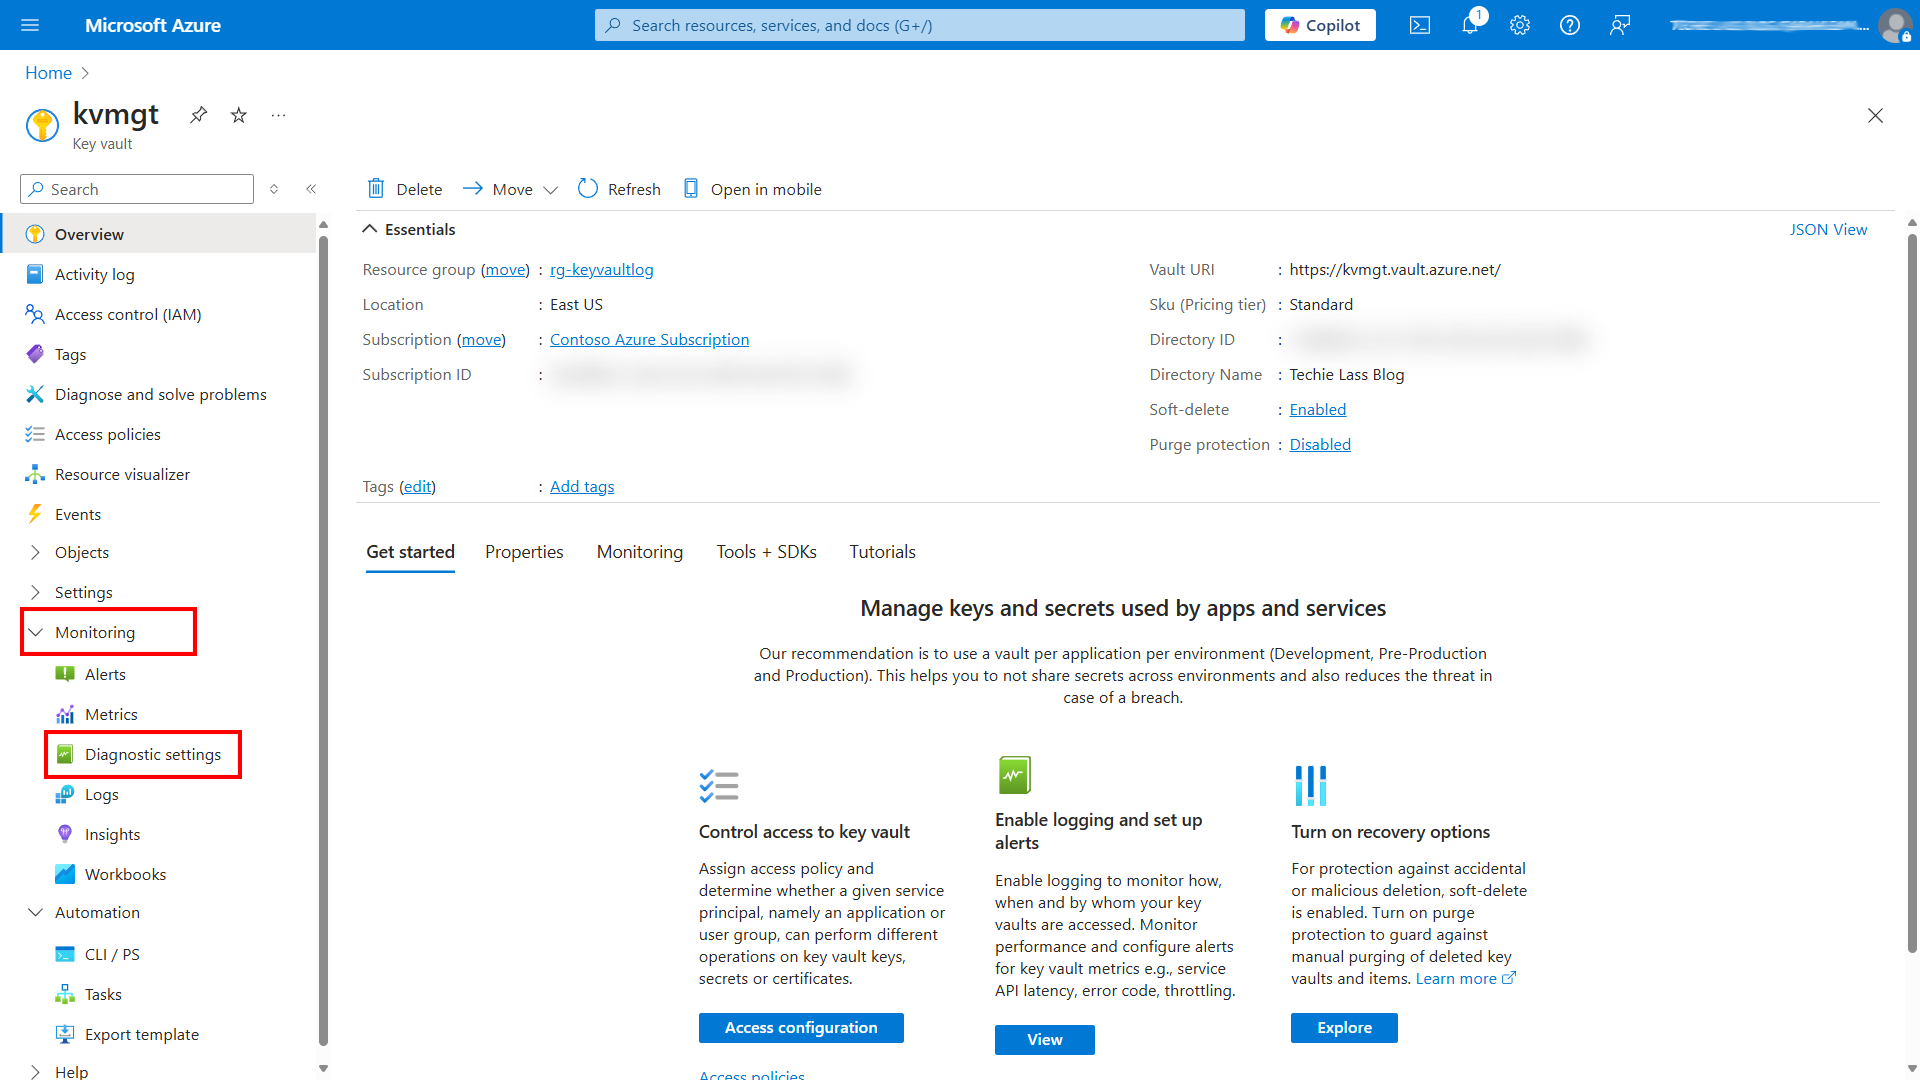
- Select the relevant resource
- Navigate to "Monitoring" and click on "Diagnostic settings".
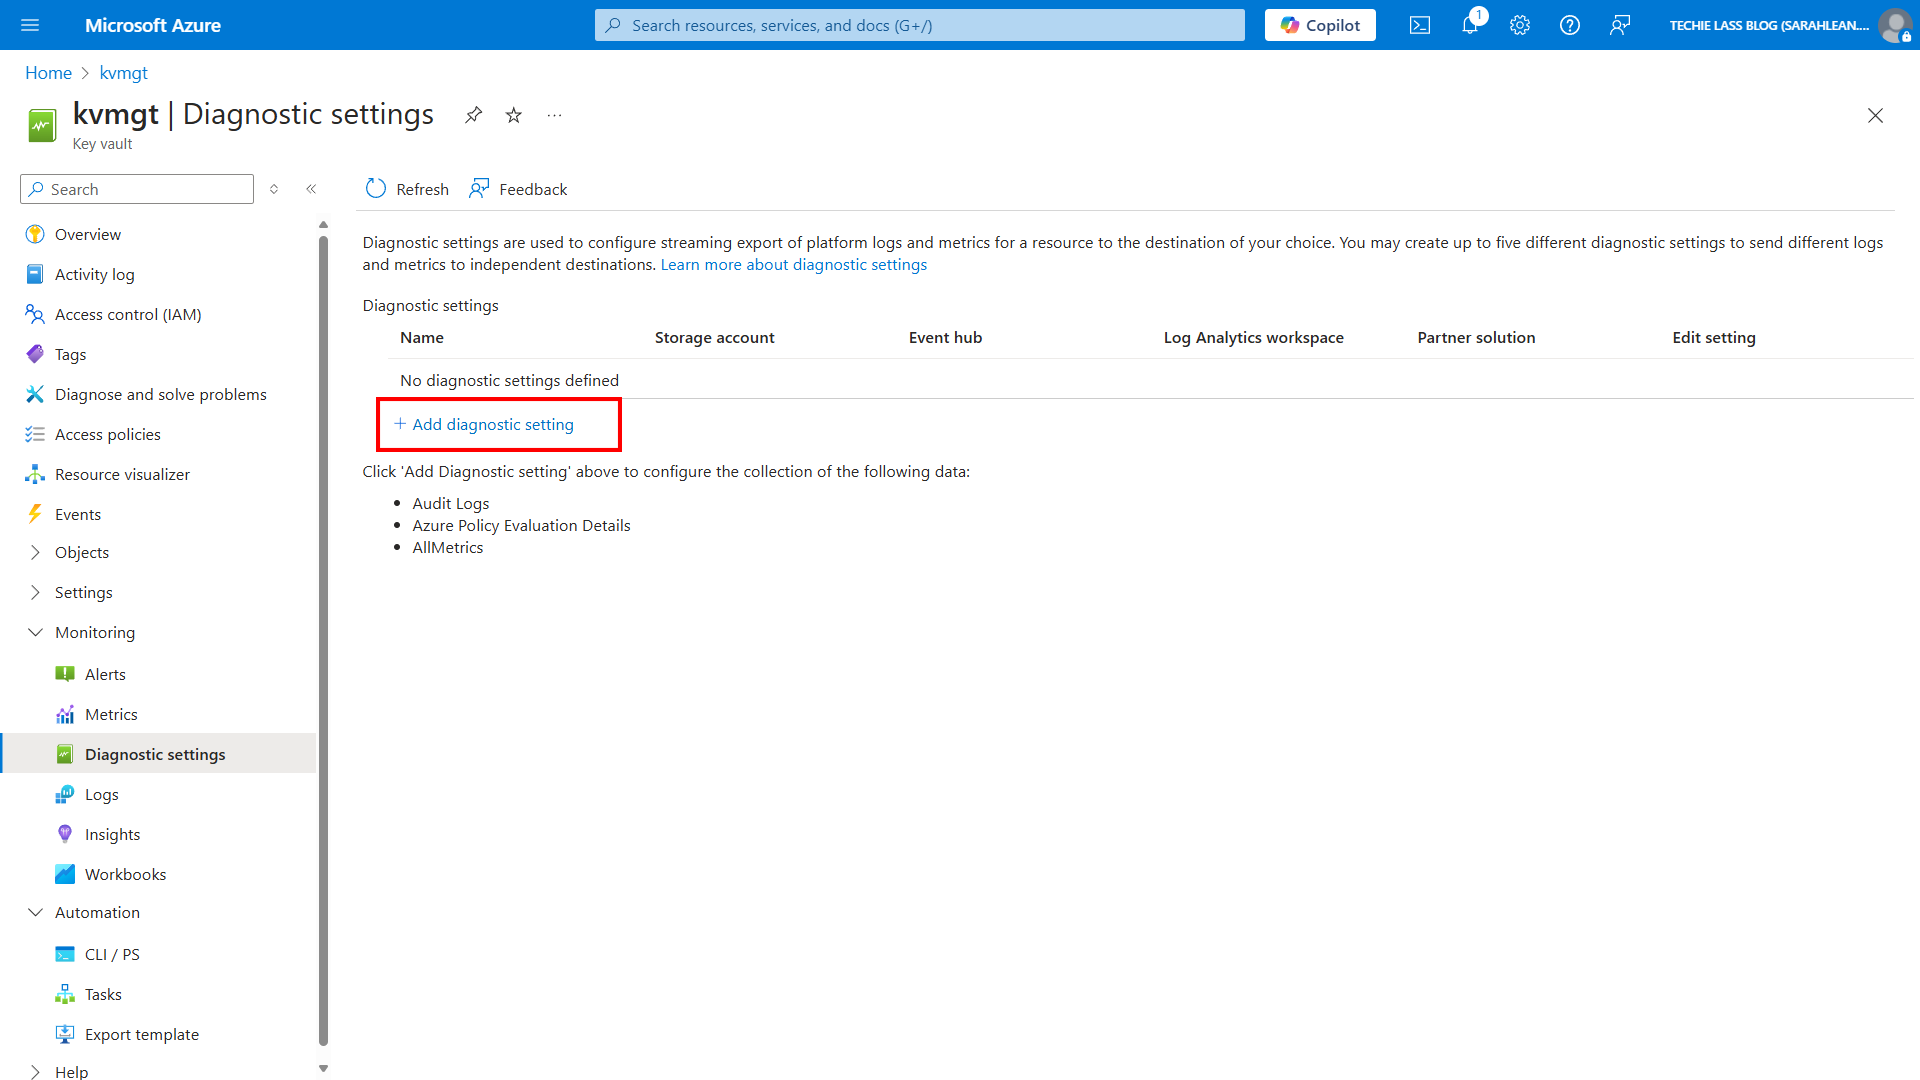
- Click "Add diagnostic setting".
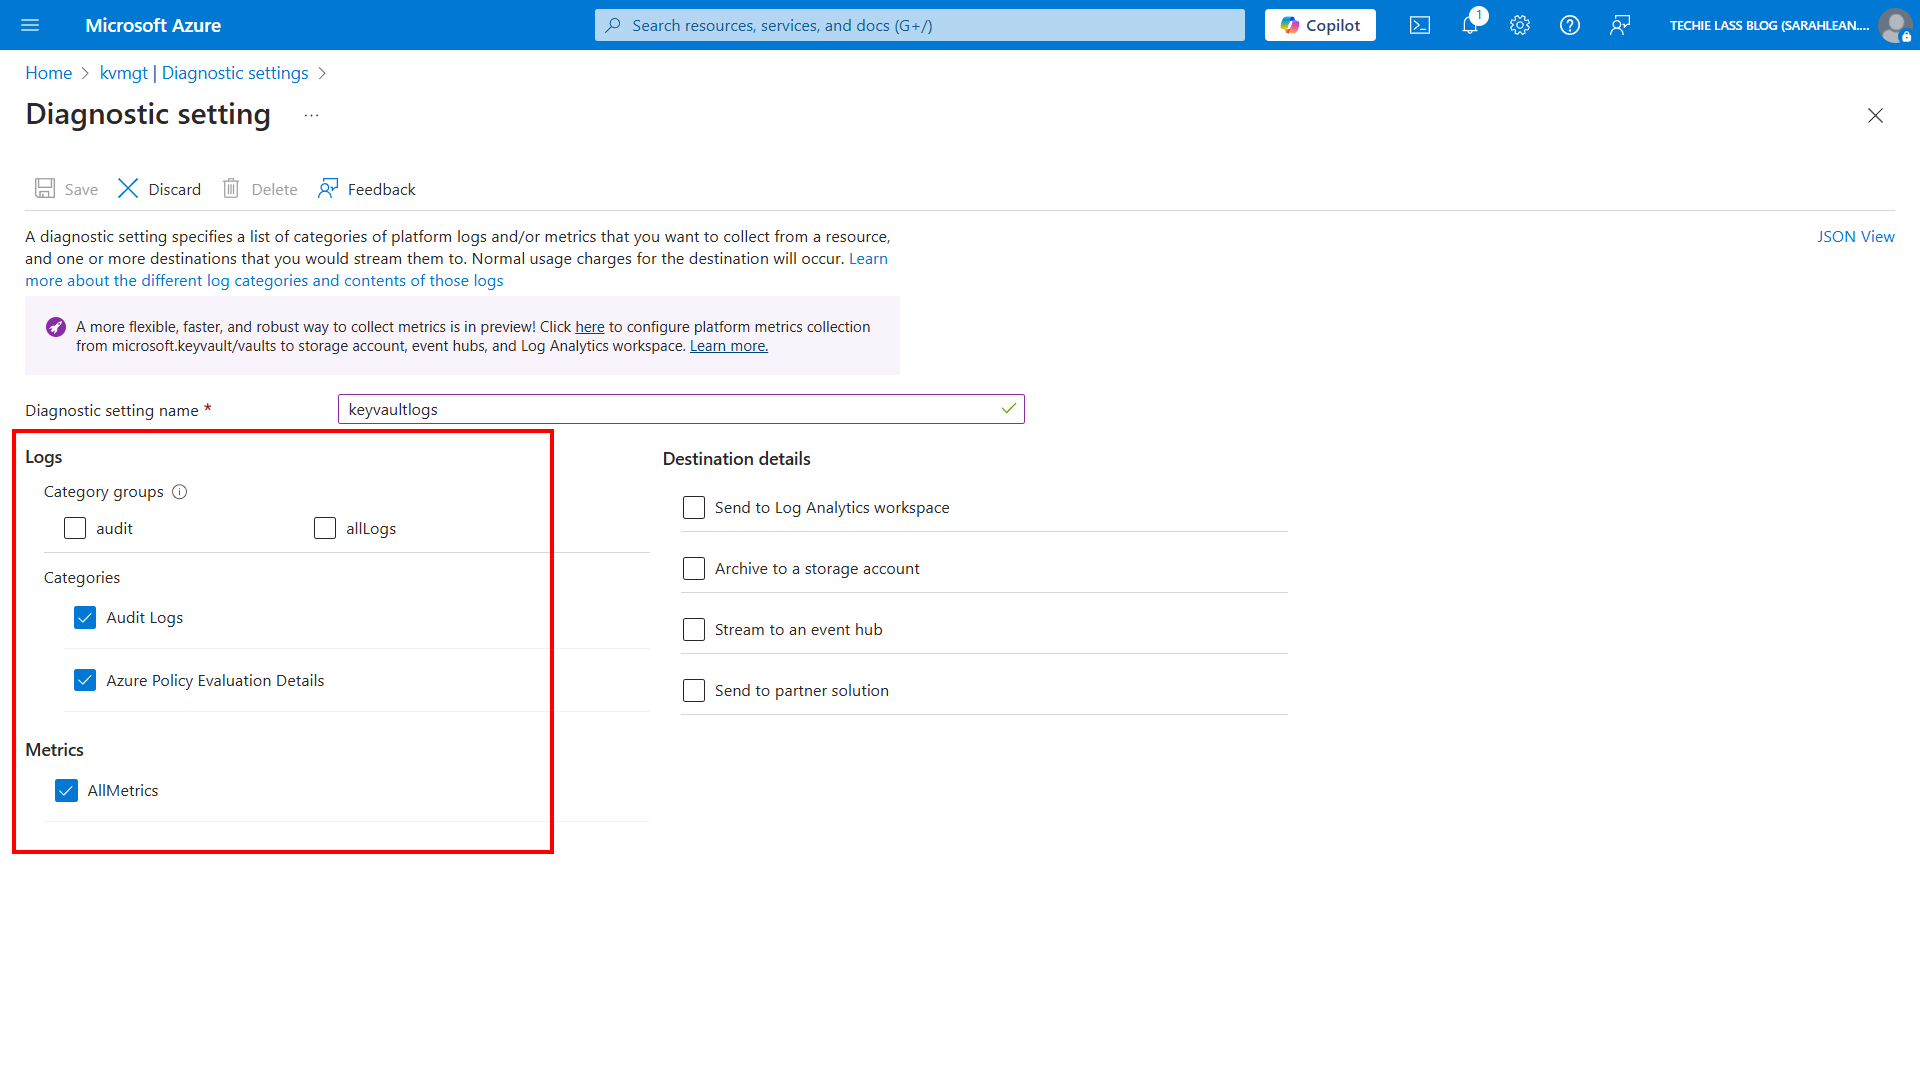
- Give the setting a relevant name.
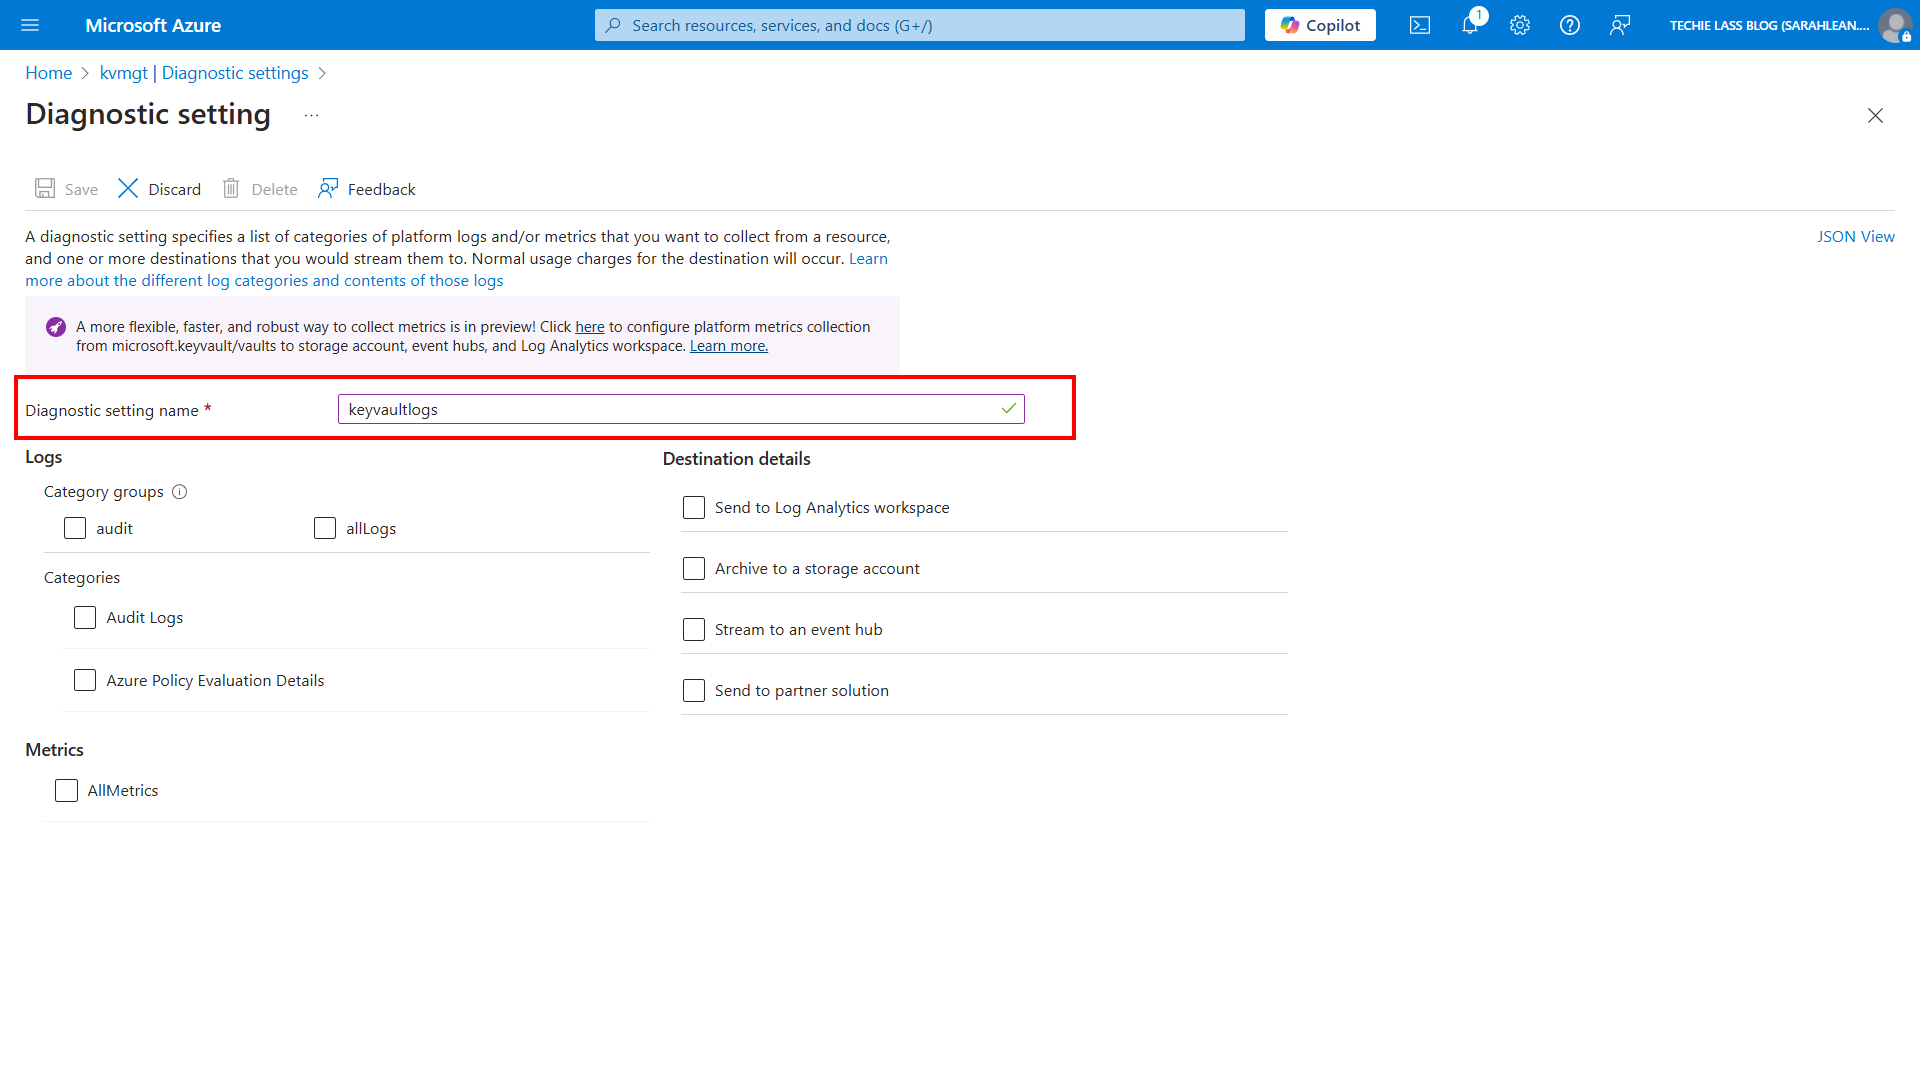
- Choose log categories and metrics to collect.
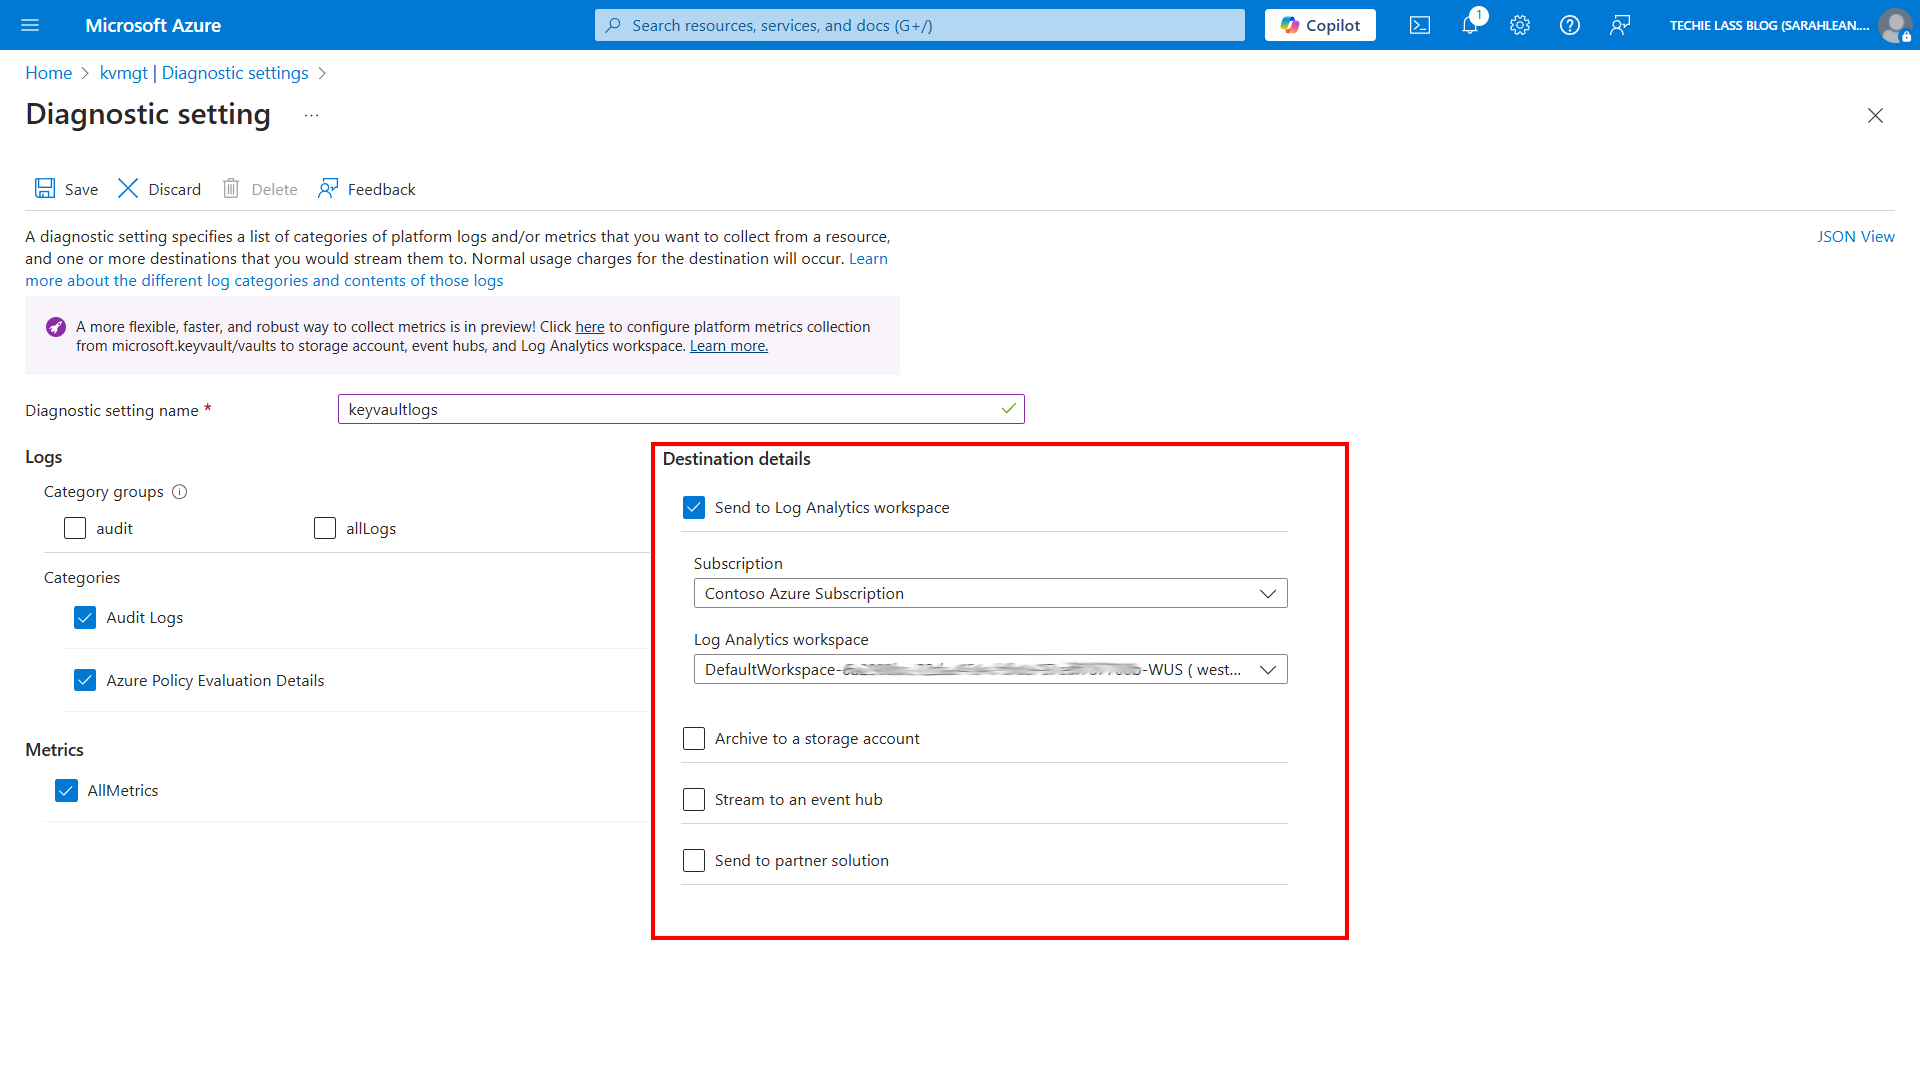
- Select the destination or destinations.
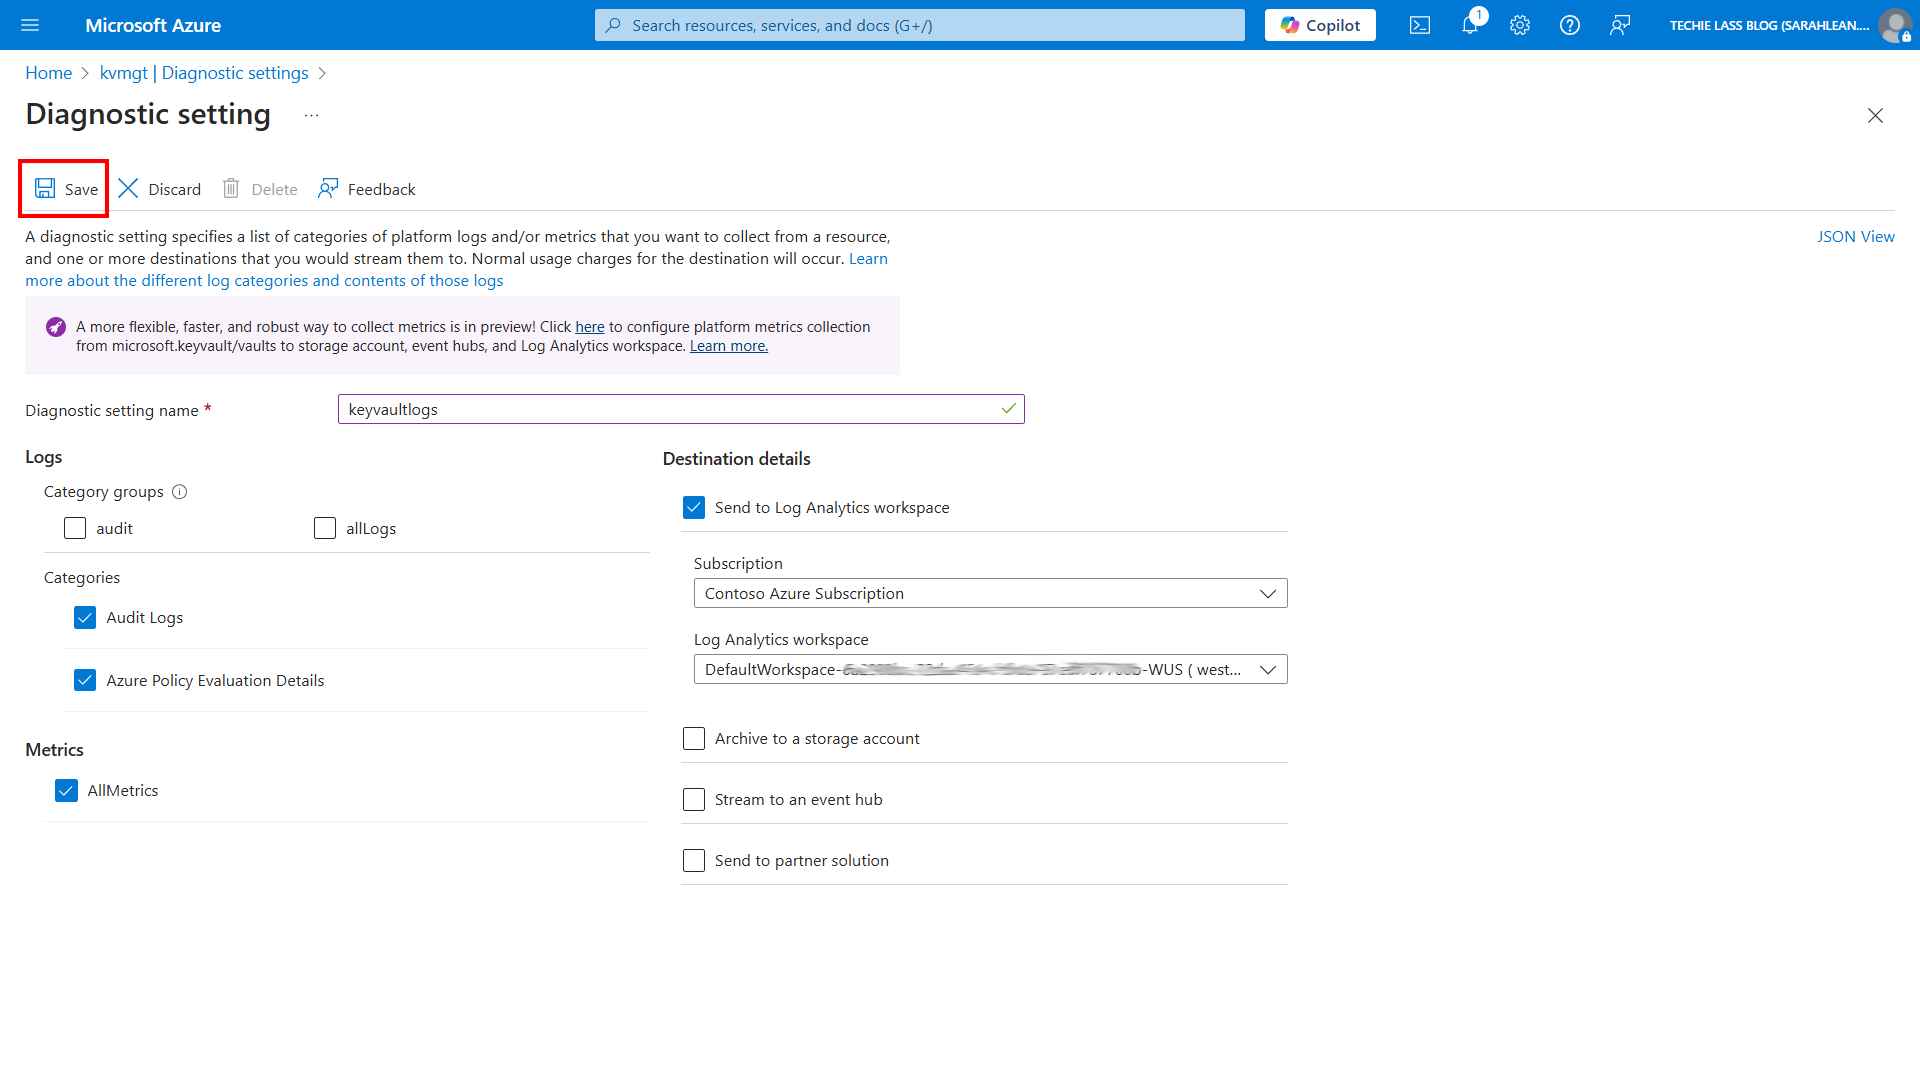
- Save the settings.
Automation tip
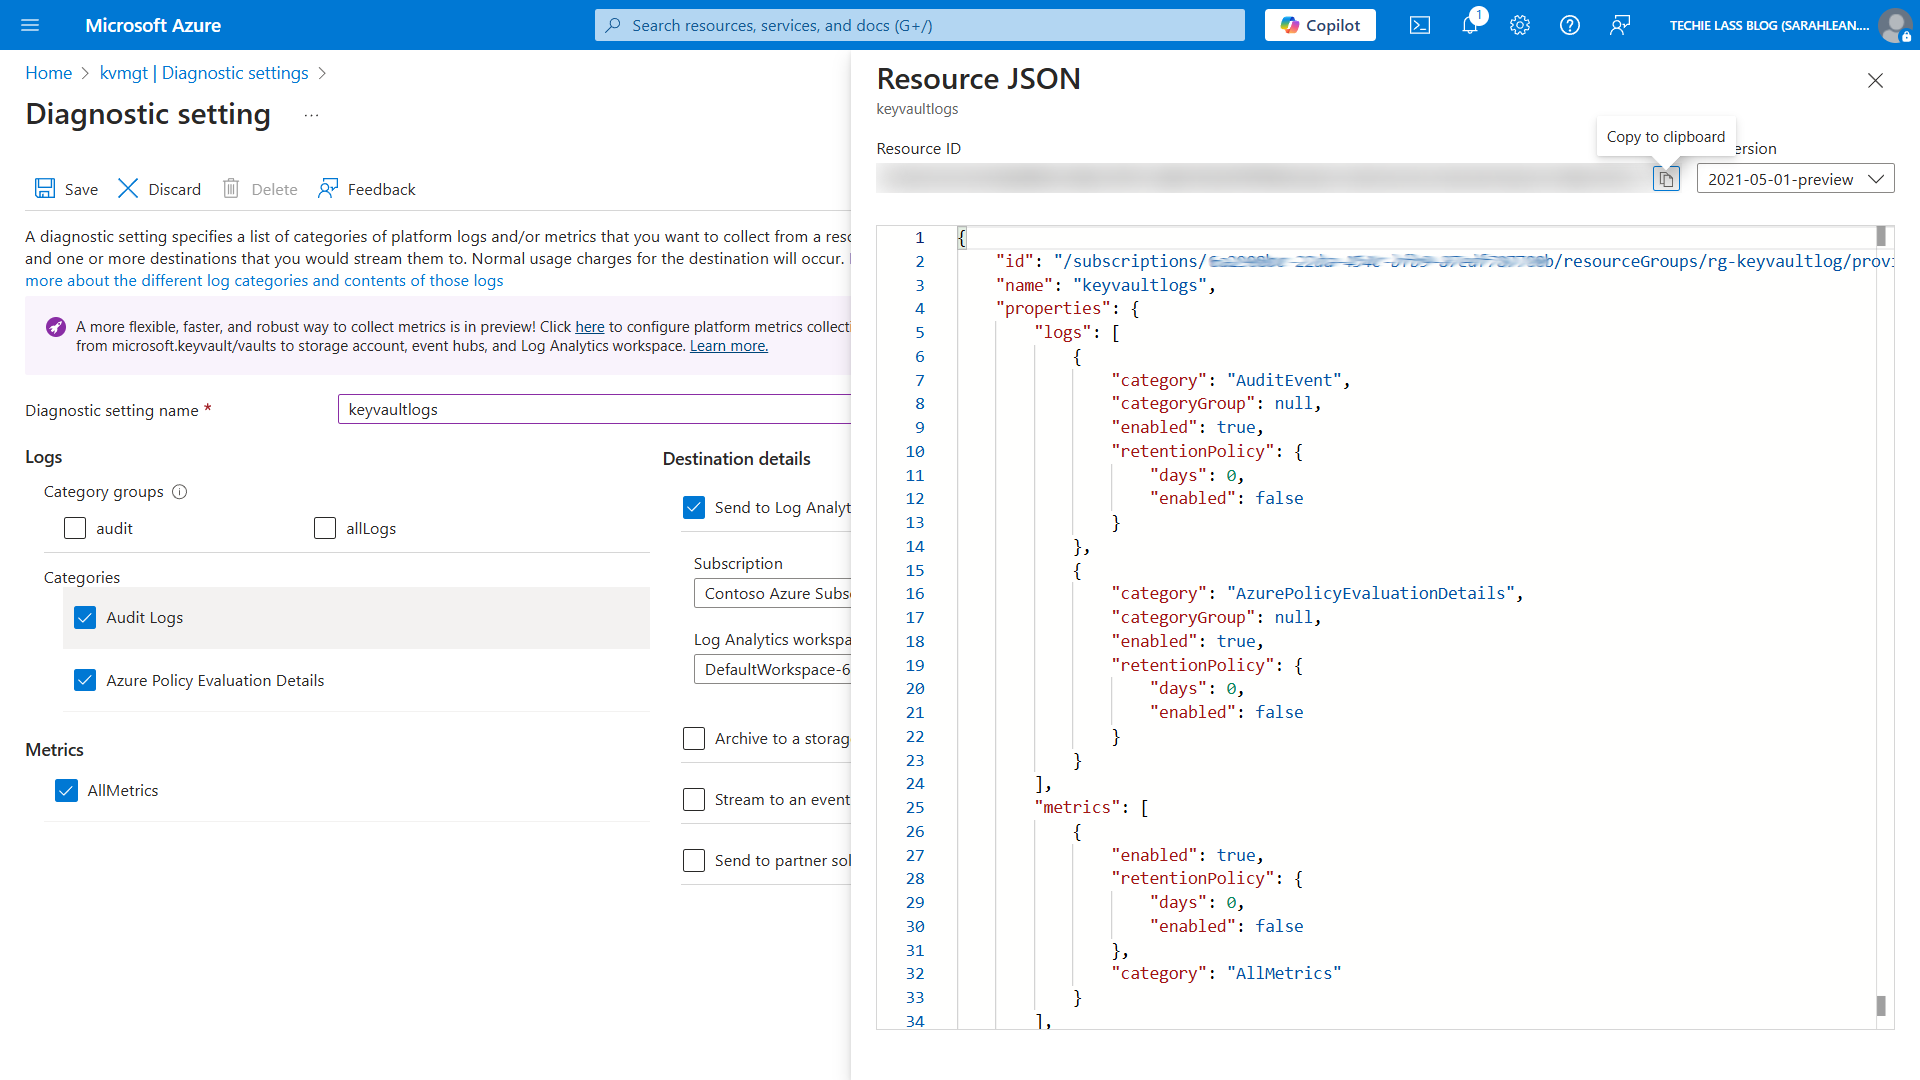
Not everyone likes to use the Azure Portal to configure resources and settings, and best practice does say that using Infrastructure as Code (IaC) is the best way to manage resources. If you are trying to configure the diagnostic settings through IaC but your unsure of the log or metric options you can come into the Azure Portal and walk through configuring the setting and then clicking on “JSON View” in the right hand corner and it will show you the category names of each log or metric you can then use in your IaC.
Best Practices for Azure Diagnostic Settings
- Enable diagnostics for key resources – Ensure diagnostics are turned on for critical services, particularly those related to security, such as Key Vault, Azure Firewall, and Virtual Machines. Logging is essential for incident investigation and meeting compliance requirements.
- Leverage Log Analytics for insights – Direct logs to Azure Monitor Log Analytics to perform structured queries, build dashboards, and configure alerts using Kusto Query Language (KQL).
- Be selective with log collection – Avoid capturing everything to prevent unnecessary storage costs and excessive noise. Focus on logs related to security, performance, and system availability.
Conclusion
We have walked through the process of enabling the Azure Monitor diagnostic settings within the Azure Portal. By enabling this setting, you ensure that critical logs are sent to the appropriate destinations.