What is Grafana?
Learn what Grafana is, how it works, its features, and how to use it with Azure Monitor or Azure Managed Grafana for powerful data visualisation.


Monitoring is essential to the health and performance of any IT system, whether it’s running in the cloud, on-premises, or somewhere in between. Without the right visibility into your environment, issues can go unnoticed until they cause downtime or impact your users.
In this blog post, let’s explore one of the monitoring tools, Grafana.
What is Grafana?
Grafana is an open-source analytics and interactive monitoring platform. It allows you to ingest data from a variety of sources, query it, create alerts, and build dashboards to visualise trends and performance metrics.
The visualisations and alerts help you transform raw metrics into actionable insights, allowing you to identify patterns, troubleshoot issues, and keep your infrastructure and applications healthy.
Grafana is fully open-source and backed by a large, active community. This gives you the flexibility to develop and share your own plugins or take advantage of those built by others.
You can choose to self-host Grafana, managing updates, backups, and scaling, or opt for a managed solution like Azure Managed Grafana, which handles all of that for you.
What data sources does Grafana use?
Grafana supports a wide variety of data sources, both out of the box and through community-developed plugins. Out of the box, the built-in data sources Grafana supports are
Cloud platforms: AWS CloudWatch, Azure Monitor, Google Cloud Monitoring
Time-series databases: InfluxDB, Graphite, OpenTSDB, Prometheus
SQL databases: Microsoft SQL Server, MySQL, PostgreSQL
Tracing & logging: Jaeger, Zipkin, Tempo, Loki
Other tools: Alertmanager, Elasticsearch, Pyroscope, TestData
Grafana features
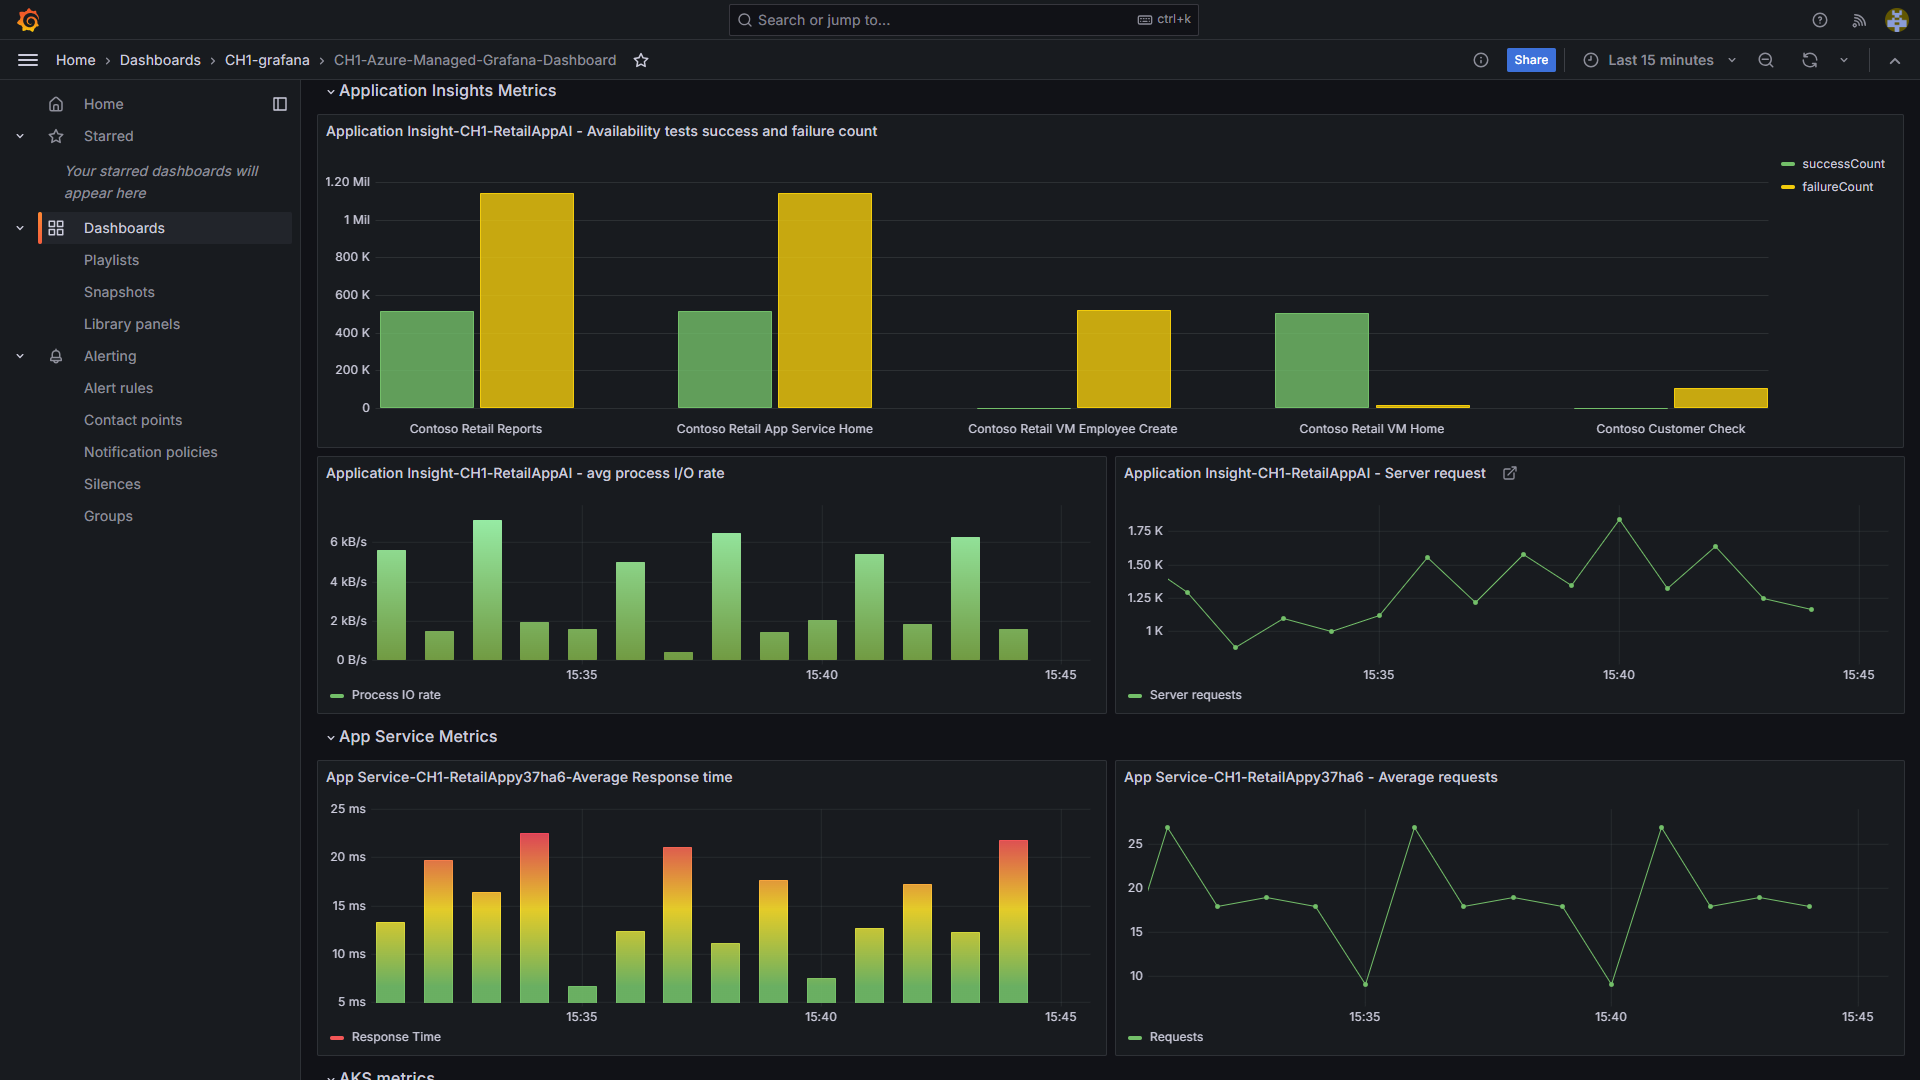
Grafana has a rich set of features designed to make monitoring and data visualisation intuitive and powerful. You can create highly customisable dashboards, these dashboards provide a central place to view your infrastructure and application health at a glance. Complementing this is the alerting system that allows you to set up rules based on your data queries so you can receive timely notifications through channels like email or Slack, helping you to act on issues quickly.
For teams that want to integrate monitoring into their workflow or automate management tasks Grafana offers a comprehensive API that lets you programmatically manage dashboards, data sources and users. And sharing is straightforward too, you can easily share live dashboards or snapshots with colleagues helping to foster collaboration and work on troubleshooting any issues together.
In addition to those core features, Grafana supports templating to create dynamic dashboards, annotations to mark significant events on graphs, and a wide range of plugins for extended functionality.
When should Grafana be used?
Grafana shines when you need to aggregate data from multiple sources and visualise it in one unified dashboard. It excels at querying time-series events, analysing logs, and building custom queries to surface the exact insights you’re after.
Even if you only have a single data source, Grafana is still a powerful tool. It helps you track infrastructure utilisation, application performance, or even website user activity—all from one interface.
Azure Monitor dashboards with Grafana
In 2025, Microsoft introduced Azure Monitor dashboards with Grafana in public preview. This feature allows you to create Grafana dashboards free using data from Azure Monitor, metrics, logs, traces, Azure Monitor managed service for Prometheus and Azure Resource Graph data sources.
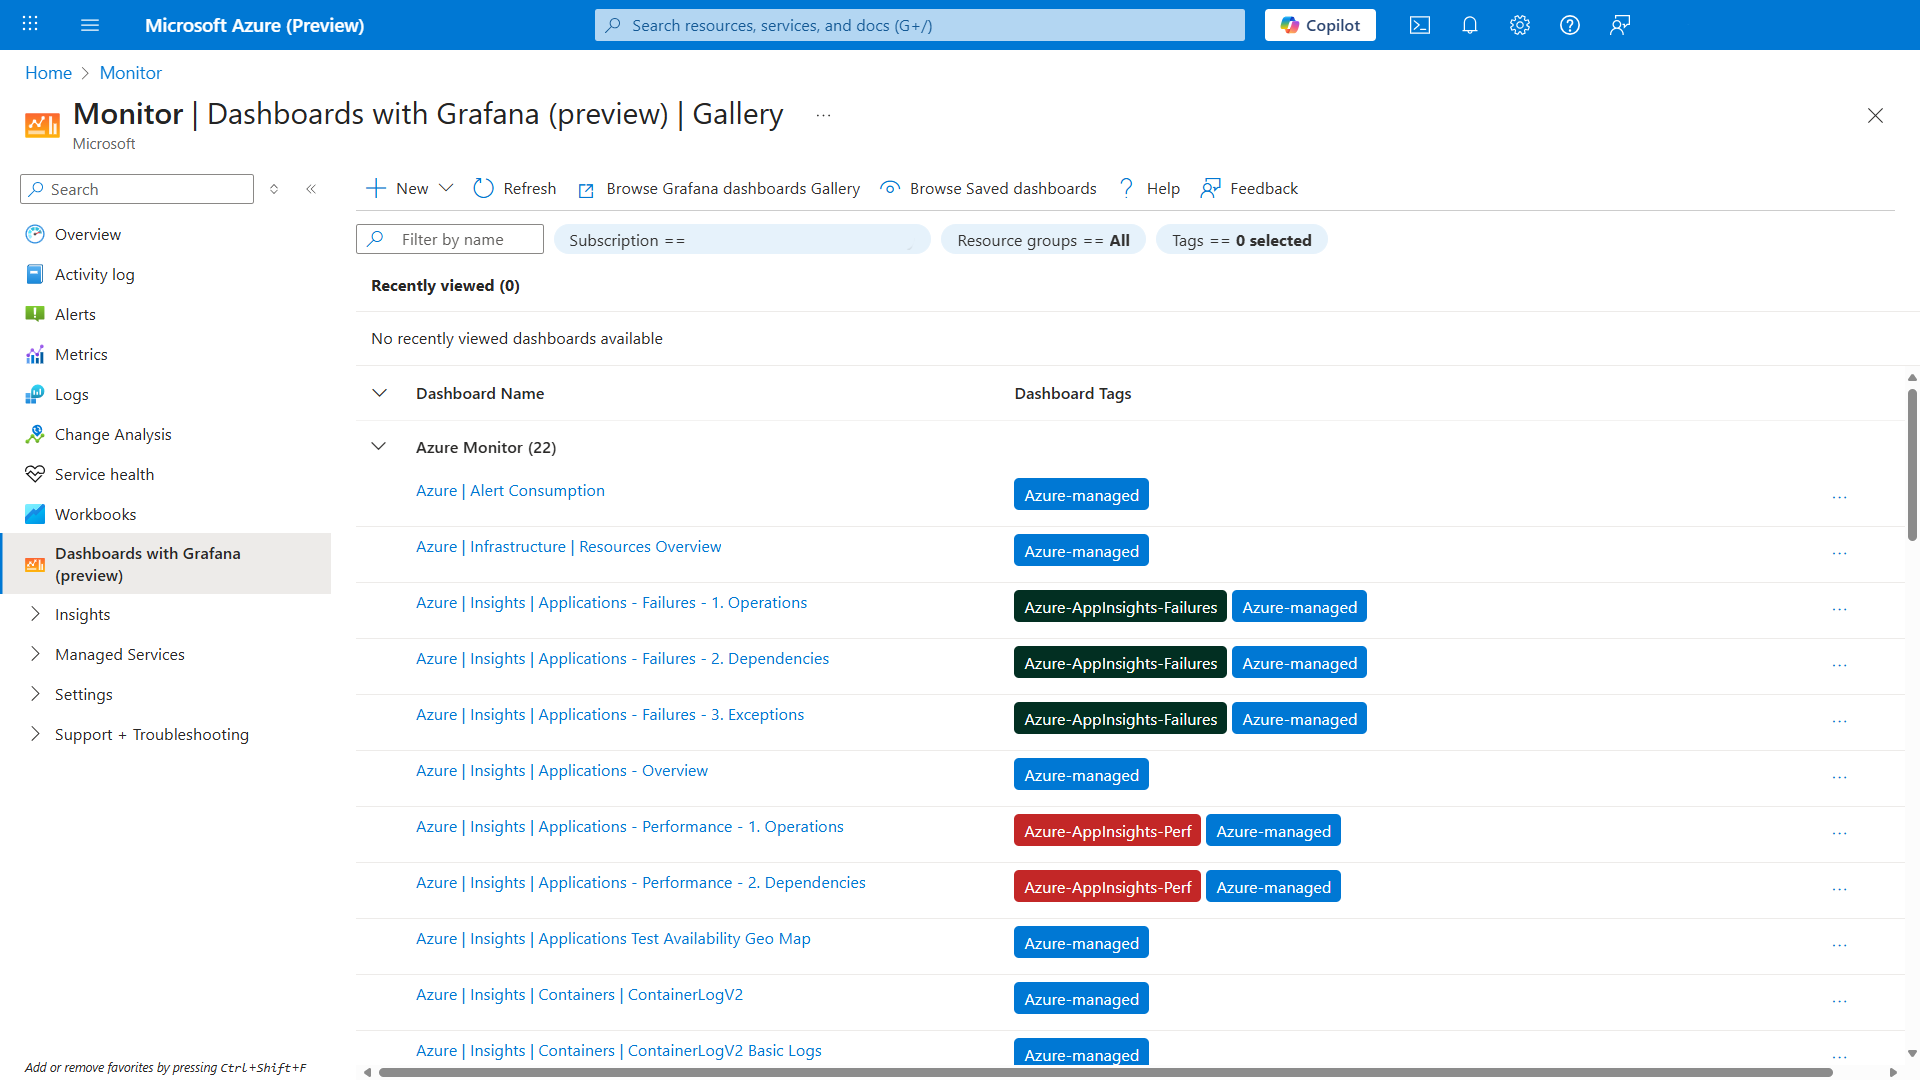
This preview feature enables you to use Grafana’s powerful visualisations without the burden of managing or paying for a full Grafana deployment. You can create and edit dashboards directly in the Azure portal or deploy them using ARM or Bicep templates. You can build dashboards from scratch or import existing ones from the Grafana community.
There are some limitations with this feature as it doesn’t support Grafana evaluated alerts, reports, library panels, snapshots, playlists, app plugins, and copying panels across different dashboards.
While available at no extra cost in preview, usage may incur charges depending on the underlying data sources and Azure Monitor usage.
Azure Managed Grafana
Azure Managed Grafana is a fully managed Grafana service operated and supported by Microsoft. It’s optimised for Azure, with built-in support for Azure Monitor and Azure Data Explorer, along with integrated user authentication via Microsoft Entra. This makes it ideal for organisations that want to use Grafana’s full capabilities without the operational overhead of managing infrastructure, updates, or scaling.
With high availability, automated upgrades, and integration into the Azure ecosystem, Azure Managed Grafana is a great option for teams focused on observability but short on time or resources for managing self-hosted deployments.

Conclusion
Monitoring is a critical part of maintaining a healthy environment, and Grafana offers a powerful, flexible platform to visualise and understand your data — no matter the system or source.
If you’re already using Azure Monitor, the Azure Monitor dashboards with Grafana preview is an excellent way to start exploring Grafana’s capabilities without the setup burden. Why not try creating your first Grafana dashboard today and see how it can transform your approach to monitoring?