Using Azure SQL and PowerBI to report on Speaking Events
In this blog post I show you how to use Azure SQL and PowerBI to store and report your public speaking events.

Someone I have followed on Twitter for a long time, Paul Andrew posted a Tweet about his speaking stats and how he'd visualised it in a PowerBI Dashboard.
I decided it was time to overhaul my #PowerBI community speaking dashboard! Especially now I've been to a few more international events... makes the maps more fun :-)
— Paul Andrew (mrpaulandrew.bsky.social) (@mrpaulandrew) November 7, 2018
TSQL and PBIX on #GitHub here if you'd like to use it: https://t.co/JFTShSggWl pic.twitter.com/WqKZIjwhVY
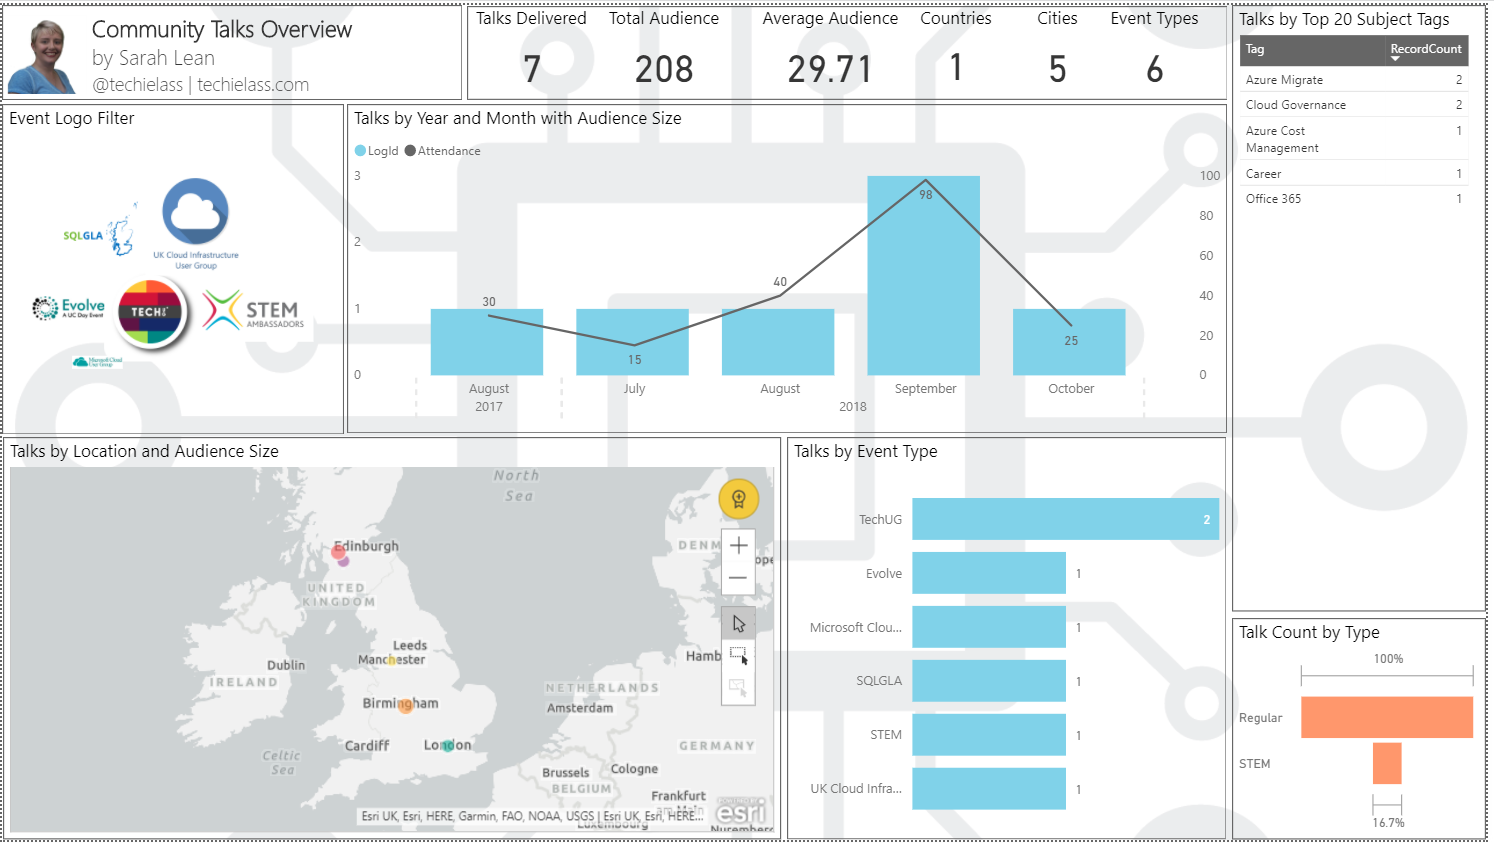
Which I thought looked amazing, so I set about taking the information he had shared publicly within his GitHub repo and trying to replicate it.
I started my public speaking journey in 2017 and thought it would be pretty cool to have a record, plus this would allow me to play with some Azure and PowerBI.
Let’s get started and deploy a solution to track your public speaking events!
Prerequisites
- Azure subscription
- PowerBI subscription (a free account is enough)
- PowerBI desktop installed on your local machine
- Visual Studio Code installed on your local machine
With the solution Paul has designed you can use any SQL database, one installed locally on your machine or one in the Cloud. I am choosing to use an Azure SQL database.
I only need a very small database that will be used sporadically and the amount of data it will hold won’t be large, so I estimate it will cost about £50 a year to run.
Deploy an Azure SQL Database
To create my Azure SQL database I am going to use Azure CLI and the Azure Cloud Shell.
Head on over to https://shell.azure.com and ensure you are using the Bash shell.
The first piece of code we need to copy into our shell window is for the variables we will be using. We need to set variables for:
- The SQL server admin user
- The SQL server password
- The name of the SQL logical server
- The Azure resource group our resources are going to reside in
- The Azure region or location we are going to use to store our resources
- The name of our SQL server
- Our IP address so we can configure access via the firewall rule
# Set the Resource Group Name
export rgname=rg-speakinglogs
# Set the Location for the resources to be deployed to
export datacenter=eastus
# Set an admin login and password for your database
export adminlogin=ServerAdmin
export password=adminpassword

# The logical server name has to be unique in the system
export servername=SpeakingStats

# Set the SQL server name
export sqlservername=recording-speaking-sql
# The IP address that you want to allow to access your DB
export startip=0.0.0.0
export endip=0.0.0.0
Be sure to change the values to match your environment and need and paste them into your shell session.
Now that we have our variables sets we’re going to create our resource group and logical SQL server.
# Create a resource group
az group create \
    --name $rgname \
    --location $datacenter \
    --tags 'Usage=Speaking'
# Create a logical server in the resource group
az sql server create \
    --name $sqlservername \
    --resource-group $rgname \
    --location $datacenter \
    --admin-user $adminlogin \
    --admin-password $password
Now the SQL server is provisioned, let’s configure the firewall rule that will allow us to interact with our database once it is deployed.
# Configure a firewall rule for the server
az sql server firewall-rule create \
    --resource-group $rgname \
    --server $sqlservername \
    -n AllowYourIp \
    --start-ip-address $startip \
    --end-ip-address $endip
With the firewall rule set, let’s deploy our database inside our server. This will create a basic database using the SQL_Lat1_General_CP1-CI-AS SQL collation.
# Create a Basic database
az sql db create \
    --resource-group $rgname \
    --server $sqlservername \
    --name SpeakingLogs \
    --collation SQL_Latin1_General_CP1_CI_AS \
    --service-objective Basic \
    --tags 'Usage=Speaking'
Now that you have the SQL Server and database created you need to connect to it and start adding data.
Connecting to your Azure SQL Database
Connecting to your Azure SQL server or database is no different than how you would interact with an on-premises SQL server/database. You can use SQL Server Management Studio (SSMS), Visual Studio Code, Visual Studio, or another tool that you like to use for SQL interactions. I spent a lot of time within Visual Studio Code, so this is going to be my connection tool.
In order to connect to SQL using Visual Studio Code you need to have the SQL Server(mssql) extension installed. You can follow my blog post if you need help to set up the extension.
Let’s connect to your database using Visual Studio Code.
Open a new file either through the GUI or using CTRL+N.
By Default Visual Studio Code creates a new file in Plain Text, we need to convert this to SQL. Press CTRL+K,M to change it to SQL.
Now we want to connect to the SQL server, do to his press CTRL+SHIFT+P to launch Visual Studio Code's Command Palette.
Type sqlcon and select the MS SQL: Add Connection by hitting return.
The first prompt will ask for your SQL server name, this will be name of the SQL server you created earlier followed by ".database.windows.net".
The second prompt will ask for the database name, again this is the name of the database you created earlier. If you used my variable definitions this will be SpeakingLogs.
The next prompt will ask you what authentication type you are using, we are using SQL Login.
The next two prompts are related to the username and password. The first one asks you for the username and the second asks you for the password.
Once you’ve put in the username and password you will be asked if you want to save the password, if you choose not to save it then you will be required to enter your password every time you want to connect.
The last prompt you are asked is if you want to specify a name for the connection profile, ensure you enter something meaningful.
Visual Studio Code will now test the connection to your SQL server and create your profile. Progress of this will be displayed in the bottom right hand corner of your screen.
Down the right hand side of your Visual Studio Code, you will see the icons relating to your extensions installed, click on the one for the SQL extension.
When you do this will launch a panel showing your connections and it should show you are now connected to your SQL server.
Setting up the Database
Before we can use the database we need to set up the database so it can store our data.
Within your blank Visual Studio Code file, paste the following code and then press CTRL+SHIFT+E to execute it.
/****** Set database settings ******/
ALTER DATABASE [SpeakingLogs] SET ANSI_NULL_DEFAULT OFF
GO
ALTER DATABASE [SpeakingLogs] SET ANSI_NULLS OFF
GO
ALTER DATABASE [SpeakingLogs] SET ANSI_PADDING OFF
GO
ALTER DATABASE [SpeakingLogs] SET ANSI_WARNINGS OFF
GO
ALTER DATABASE [SpeakingLogs] SET ARITHABORT OFF
GO
ALTER DATABASE [SpeakingLogs] SET AUTO_SHRINK OFF
GO
ALTER DATABASE [SpeakingLogs] SET AUTO_UPDATE_STATISTICS ON
GO
ALTER DATABASE [SpeakingLogs] SET CURSOR_CLOSE_ON_COMMIT OFF
GO
ALTER DATABASE [SpeakingLogs] SET CONCAT_NULL_YIELDS_NULL OFF
GO
ALTER DATABASE [SpeakingLogs] SET NUMERIC_ROUNDABORT OFF
GO
ALTER DATABASE [SpeakingLogs] SET QUOTED_IDENTIFIER OFF
GO
ALTER DATABASE [SpeakingLogs] SET RECURSIVE_TRIGGERS OFF
GO
ALTER DATABASE [SpeakingLogs] SET ALLOW_SNAPSHOT_ISOLATION ON
GO
ALTER DATABASE [SpeakingLogs] SET PARAMETERIZATION SIMPLE
GO
ALTER DATABASE [SpeakingLogs] SET READ_COMMITTED_SNAPSHOT ON
GO
ALTER DATABASE [SpeakingLogs] SET  MULTI_USER
GO
ALTER DATABASE [SpeakingLogs] SET ENCRYPTION ON
GO
ALTER DATABASE [SpeakingLogs] SET QUERY_STORE = ON
GO
ALTER DATABASE [SpeakingLogs] SET QUERY_STORE (OPERATION_MODE = READ_WRITE, CLEANUP_POLICY = (STALE_QUERY_THRESHOLD_DAYS = 30), DATA_FLUSH_INTERVAL_SECONDS = 900, INTERVAL_LENGTH_MINUTES = 60, MAX_STORAGE_SIZE_MB = 100, QUERY_CAPTURE_MODE = AUTO, SIZE_BASED_CLEANUP_MODE = AUTO)
GO
USE [SpeakingLogs]
GO
ALTER DATABASE SCOPED CONFIGURATION SET BATCH_MODE_ADAPTIVE_JOINS = ON;
GO
ALTER DATABASE SCOPED CONFIGURATION SET BATCH_MODE_MEMORY_GRANT_FEEDBACK = ON;
GO
ALTER DATABASE SCOPED CONFIGURATION SET ELEVATE_ONLINE = OFF;
GO
ALTER DATABASE SCOPED CONFIGURATION SET ELEVATE_RESUMABLE = OFF;
GO
ALTER DATABASE SCOPED CONFIGURATION SET GLOBAL_TEMPORARY_TABLE_AUTO_DROP = ON;
GO
ALTER DATABASE SCOPED CONFIGURATION SET IDENTITY_CACHE = ON;
GO
ALTER DATABASE SCOPED CONFIGURATION SET INTERLEAVED_EXECUTION_TVF = ON;
GO
ALTER DATABASE SCOPED CONFIGURATION SET ISOLATE_SECURITY_POLICY_CARDINALITY = OFF;
GO
ALTER DATABASE SCOPED CONFIGURATION SET LEGACY_CARDINALITY_ESTIMATION = OFF;
GO
ALTER DATABASE SCOPED CONFIGURATION FOR SECONDARY SET LEGACY_CARDINALITY_ESTIMATION = PRIMARY;
GO
ALTER DATABASE SCOPED CONFIGURATION SET MAXDOP = 0;
GO
ALTER DATABASE SCOPED CONFIGURATION FOR SECONDARY SET MAXDOP = PRIMARY;
GO
ALTER DATABASE SCOPED CONFIGURATION SET OPTIMIZE_FOR_AD_HOC_WORKLOADS = OFF;
GO
ALTER DATABASE SCOPED CONFIGURATION SET PARAMETER_SNIFFING = ON;
GO
ALTER DATABASE SCOPED CONFIGURATION FOR SECONDARY SET PARAMETER_SNIFFING = PRIMARY;
GO
ALTER DATABASE SCOPED CONFIGURATION SET QUERY_OPTIMIZER_HOTFIXES = OFF;
GO
ALTER DATABASE SCOPED CONFIGURATION FOR SECONDARY SET QUERY_OPTIMIZER_HOTFIXES = PRIMARY;
GO
ALTER DATABASE SCOPED CONFIGURATION SET XTP_PROCEDURE_EXECUTION_STATISTICS = OFF;
GO
ALTER DATABASE SCOPED CONFIGURATION SET XTP_QUERY_EXECUTION_STATISTICS = OFF;
GO
/****** Create Speaking Log Table ******/
SET ANSI_NULLS ON
GO
SET QUOTED_IDENTIFIER ON
GO
CREATE TABLE [dbo].[SpeakingLogs](
	[LogId] [int] IDENTITY(1,1) NOT NULL,
	[TalkDate] [date] NOT NULL,
	[EventName] [varchar](255) NOT NULL,
	[City] [varchar](255) NULL,
	[Country] [varchar](255) NULL,
	[Lat] [float](20) NULL,
	[Long] [float](20) NULL,
	[Attendance] [int] NULL,
	[Tags] [nvarchar](1024) NULL,
	[TalkType] [varchar](100) NULL,
 CONSTRAINT [PK_SpeakingLogs] PRIMARY KEY CLUSTERED
(
	[LogId] ASC
)WITH (STATISTICS_NORECOMPUTE = OFF, IGNORE_DUP_KEY = OFF) ON [PRIMARY]
) ON [PRIMARY]
GO
/****** Create Event Logo Table ******/
SET ANSI_NULLS ON
GO
SET QUOTED_IDENTIFIER ON
GO
CREATE TABLE [dbo].[EventLogos](
	[EventName] [varchar](255) NOT NULL,
	[ImageURL] [nvarchar](max) NULL
) ON [PRIMARY] TEXTIMAGE_ON [PRIMARY]
GO
The above, sets up your database and also creates the two tables that you need. One for recording your speaking event information and one for the event logos.
Entering your Data
Now that you've got the infrastructure set up, it's time to start adding your speaking data.
You have two tables, one that holds all your speaking stats (SpeakingLog) and the other table (EventLogos) is used to store the location of the logos of events you've spoken at.
When you enter a record to the SpeakingLogs table you need to feed it the following information:
- Date
- Event Name
- City
- Country
- Latitude of the event venue
- Longitude of the event venue
- How many people were in the audience
- The talk topic
- And what type of talk it was (Regular, Lightning Talk, virtual, etc)
Let’s create a record in the SpeakingLogs table. Open a new file within Visual Studio Code and convert it from plain text to SQL.
Paste the following code into your file and then press CTRL+SHIFT+E to execute it.
Insert into [dbo].[SpeakingLogs]
Values
('11/08/2018', 'STEM', 'Reading', 'United Kingdom', '51.461231', '-0.925947', '25', 'Azure', 'Regular')
The record will be added to your database after a few seconds, you can view the results of your data input with this command:
Select * from [dbo].[SpeakingLogs]
Now we want to update the EventLogos table. Each time we input data to that table we need to provide it with the following information:
- Event name
- Location of the logo (typically a URL)
To create a corresponding event logo to the speaking logs entry we can use the following code:
Insert into [dbo].[EventLogos]
VALUES
('STEM', 'https://www.stem.org.uk/sites/all/themes/custom/stem_base/assets/img/patterns/logo-stem-new.svg')
Again if you want to see the results of your data input you can use the command:
Select * from [dbo].[EventLogos]
Visualise the data in PowerBI
Download a copy of the PowerBI template I use here.
Once you have downloaded the .PBIX file, open it using PowerBI desktop.
The first thing to do is change the Data Source within the .PBIX file to your SQL database. To do this follow these steps:
- Click on File > Options & Settings > Data source settings
- Select Change source
- Input your SQL server name and click OK
- Click on close
When you return to your PowerBI Report you'll see a yellow ribbon along the top. Asking you to apply the changes.

When you click on the apply changes button, you will be prompted to enter credentials for the SQL database. Ensure you click on the Database option and input your username and password.
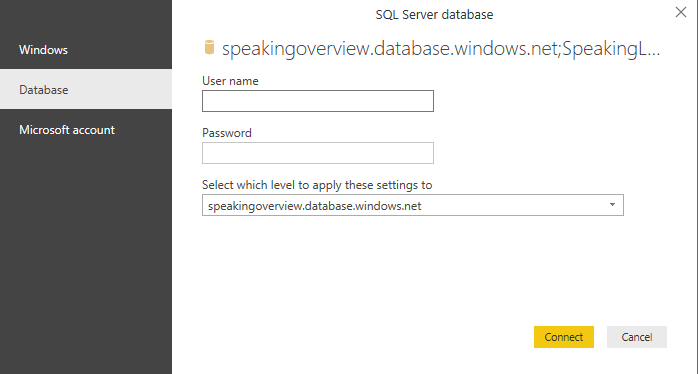
PowerBI will connect to your SQL database and start to pull in your data, you should see the report refresh and apply your data.
The next thing to change is the profile pic and contact information. Replace the picture and information with your own.
Once this is done be sure to save your settings. You should end up with a custom report showing your speaking results.
Overview
I love finding wee gems like this and getting the chance to learn something new along the way. Thanks again Paul Andrew for sharing.