Track basic metrics such as CPU, Disk and Memory Usage within Operations Management Suite
In this blog post I share how to track some basic metrics within Operations Management Suite.

I was recently asked if there was a way of tracking basic metrics from Virtual Machine (VM) within Operations Management Suite (OMS), such as CPU usage, Disk Usage and Memory Usage. Unfortunately there isn't out the box available within OMS that can be easily set up to do this. However the ability to do it does exist with a little bit of configuration. You are able to collect this data at frequent intervals to allow for Near Real Time (NRT) analysis or for longer term analysis. If you need help creating an OMS space within Azure please check out the blog post I wrote earlier to do this - Creating a Operations Management Suite Workspace in Azure
Basic Metrics Collection
The first step in the process is to configure OMS to collect the data/stats that you want to display, in order to do that follow these steps:
-
Log into your OMS Console
-
In the right hand corner click on the Settings button (the cog)
-
Now click on Data
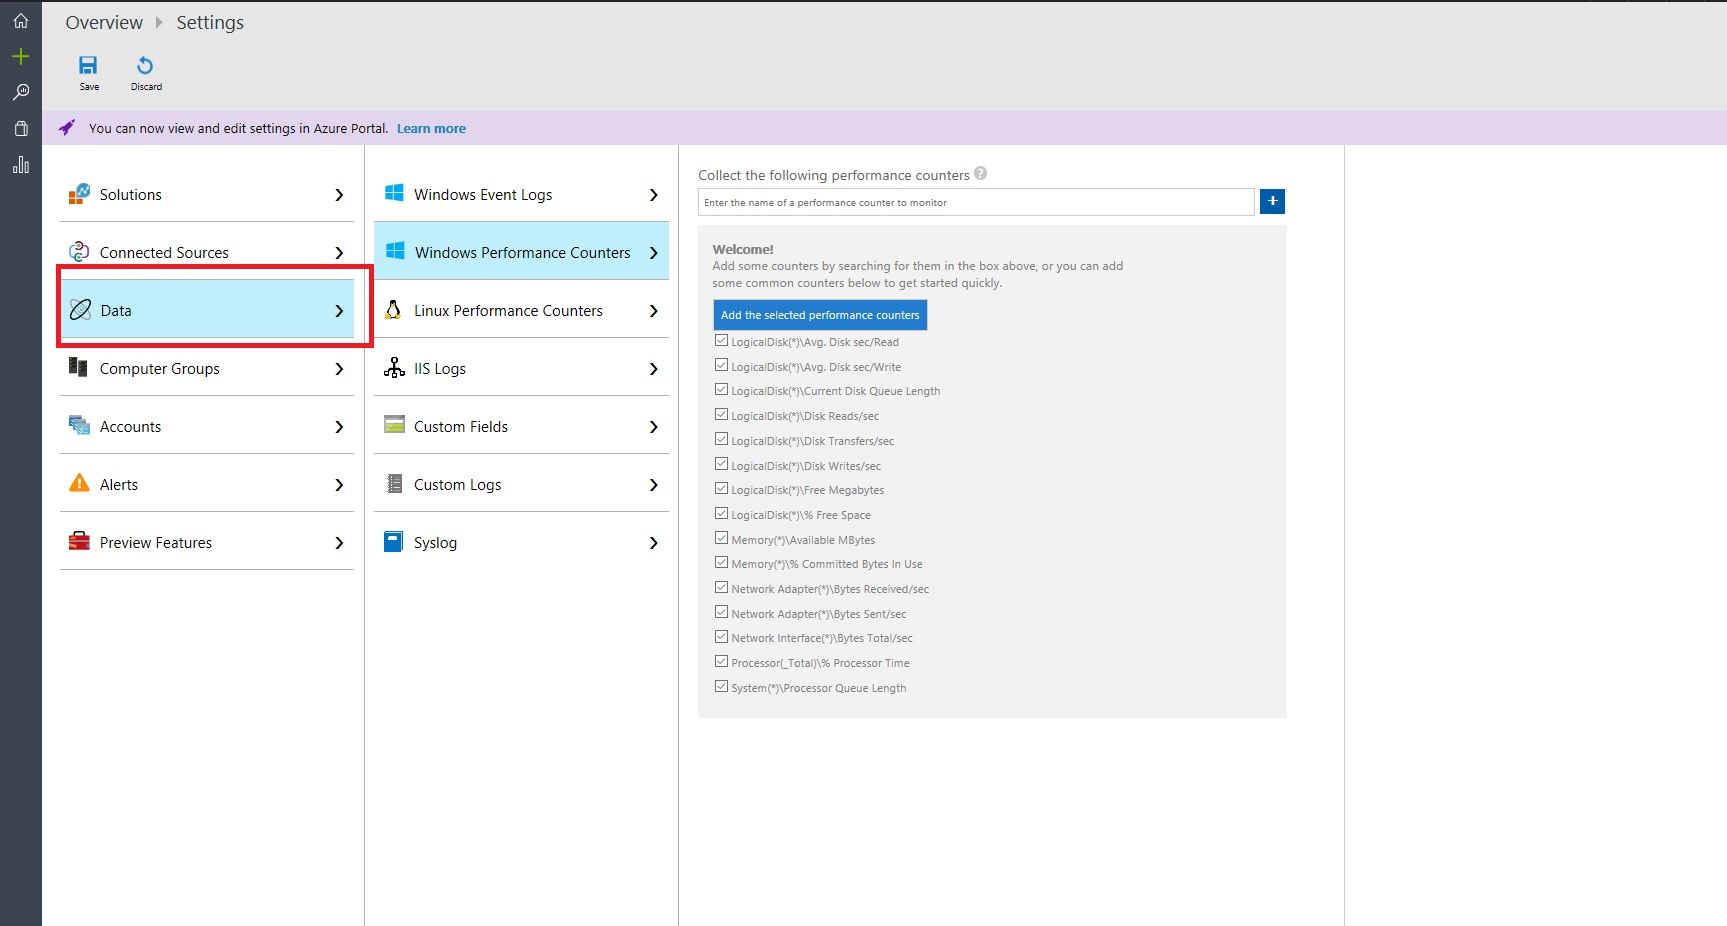
-
Now select the Windows Performance Counters option
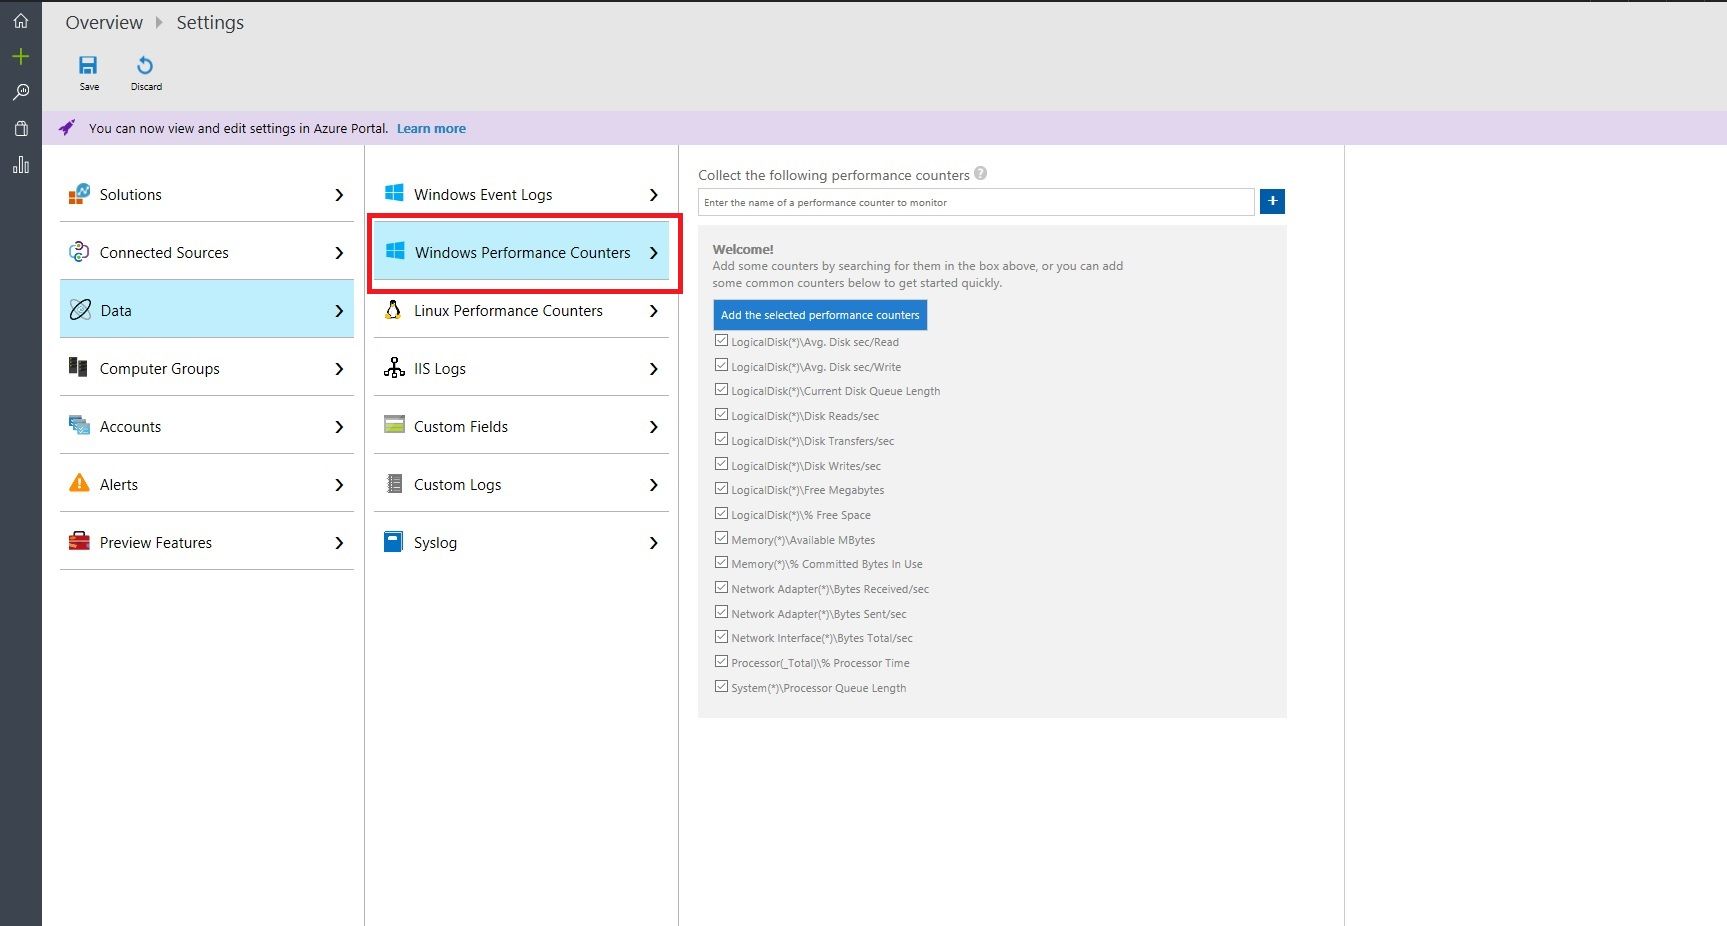
-
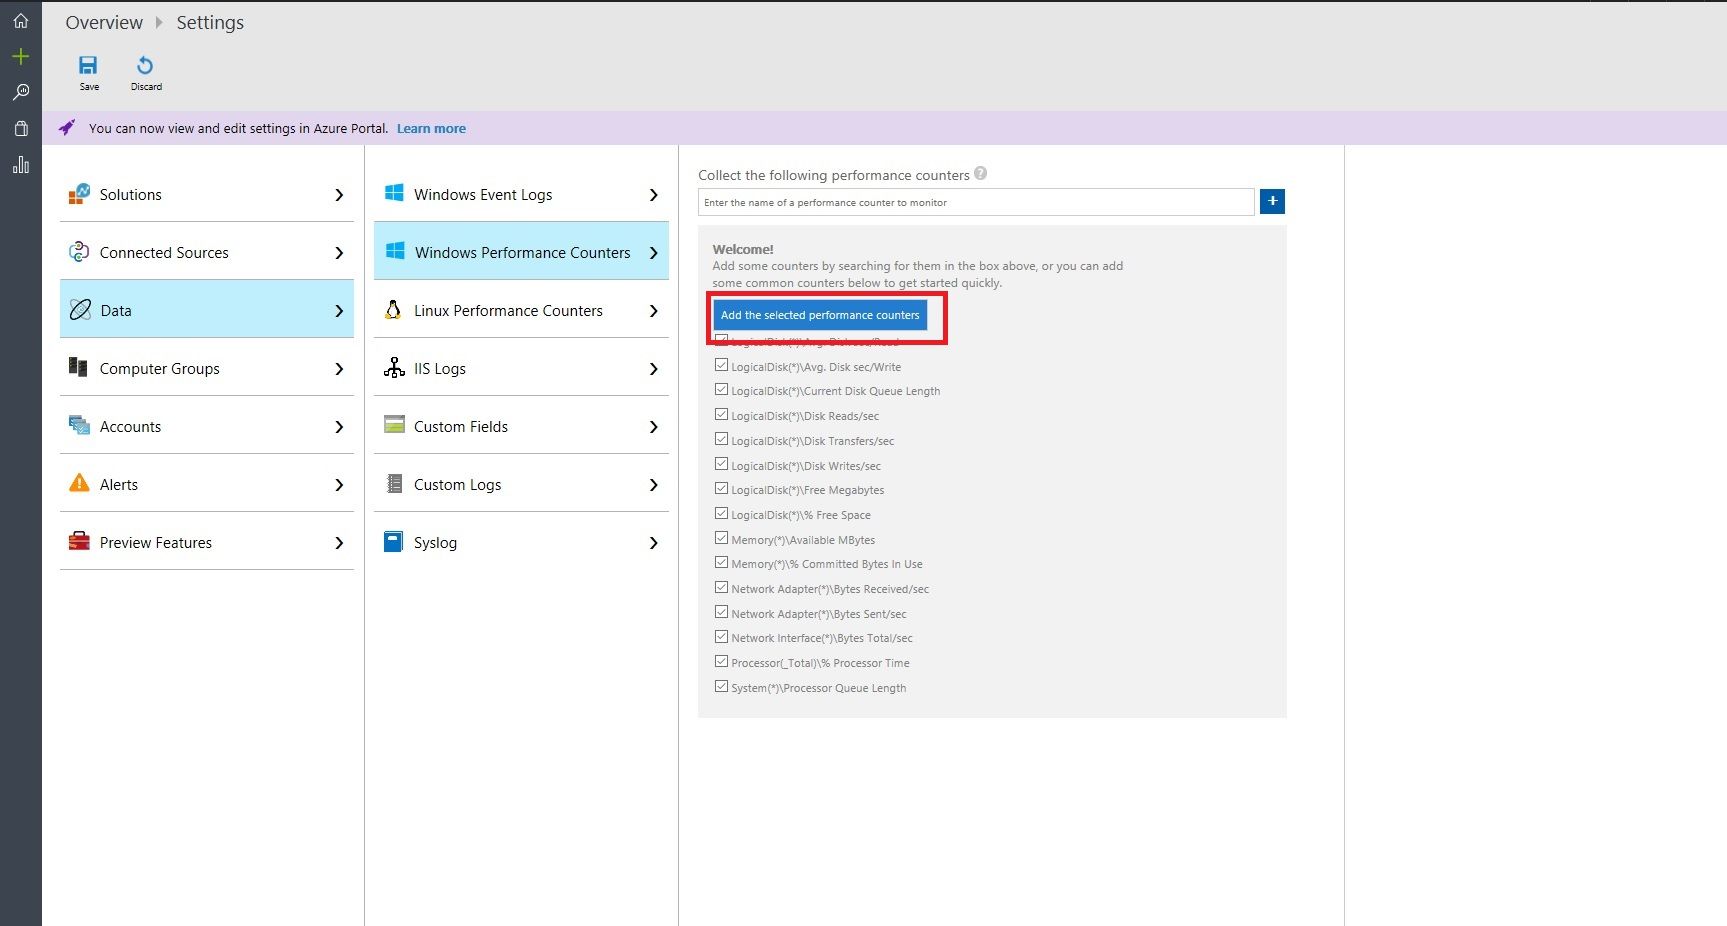
OMS gives you a list of common counters that you can start collecting data about or you can add your own, I would suggest starting with the suggested list and tweaking as you go. To do this click on the "Add the selected performance counters" button
-
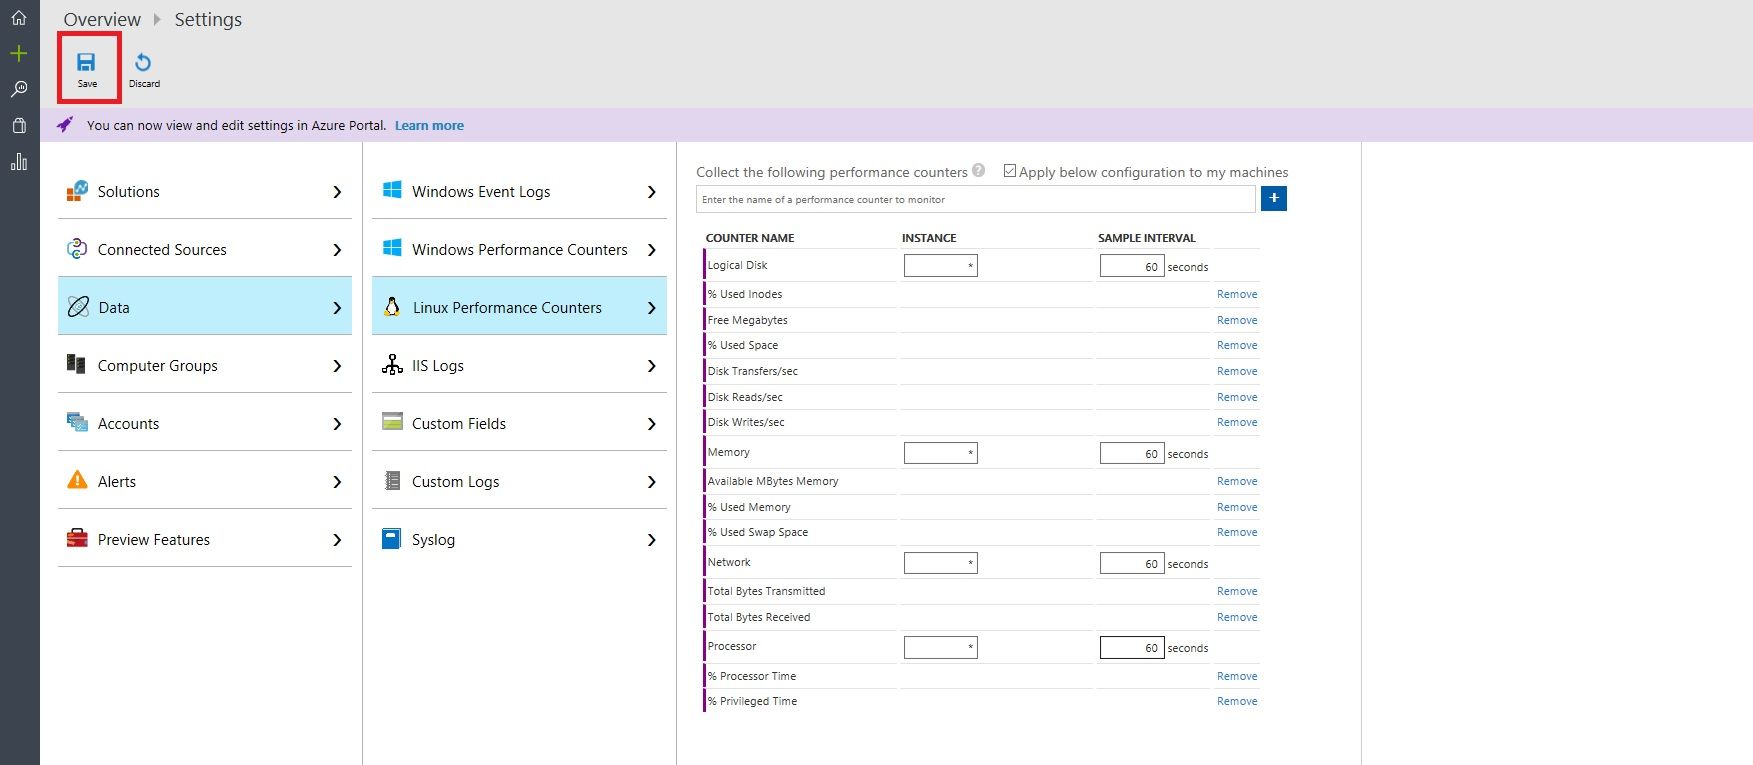
Modify the sample interval collection time to what is appropriate to your environment and needs. I've set mine to collect every 60 seconds. Now that you have the list of counters and collection interval set, click on the save button in the left hand corner to apply this setting your environment

-
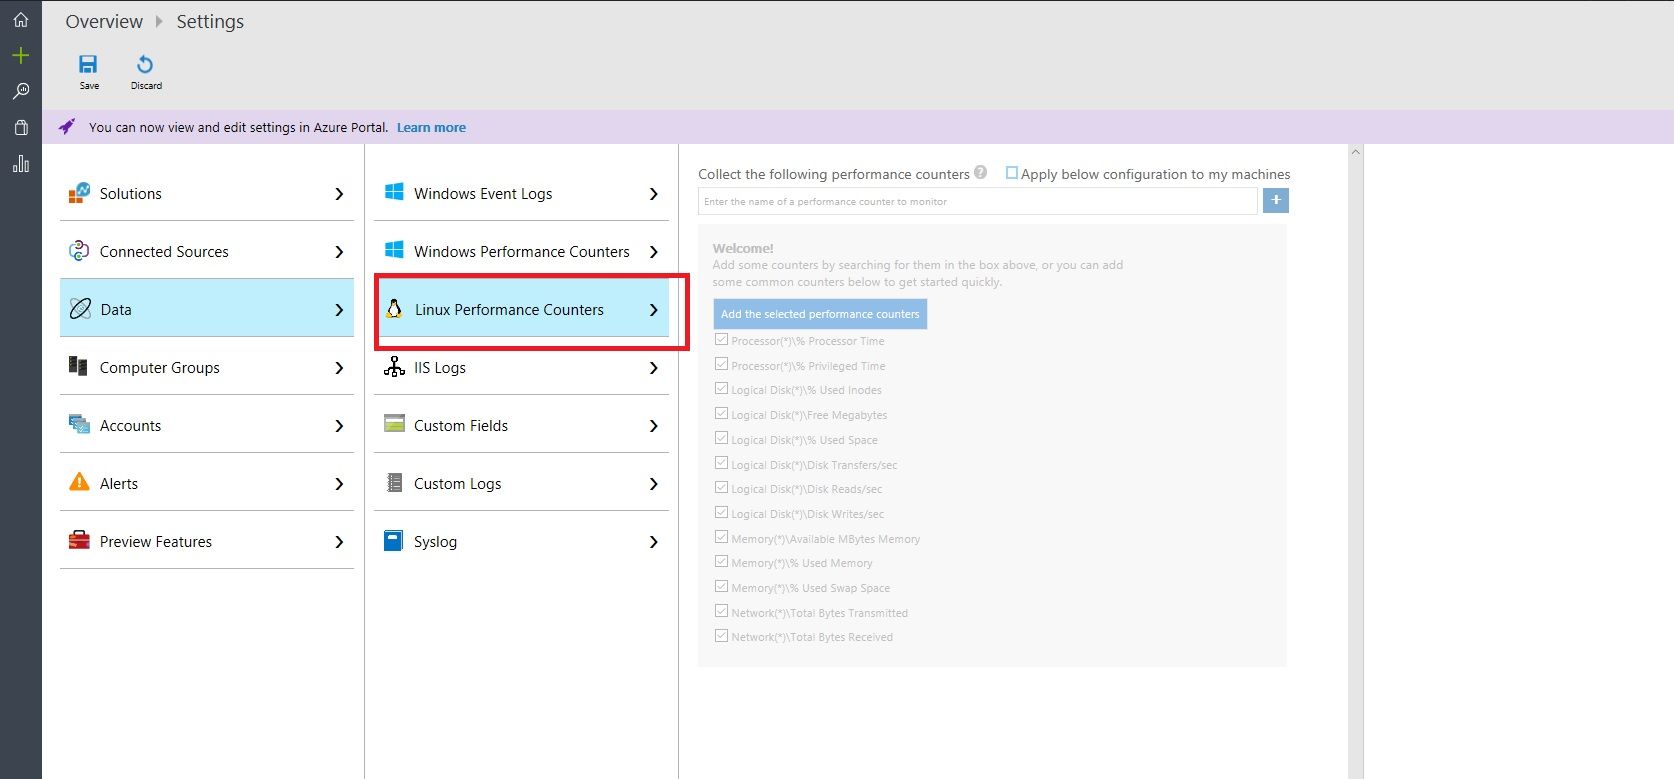
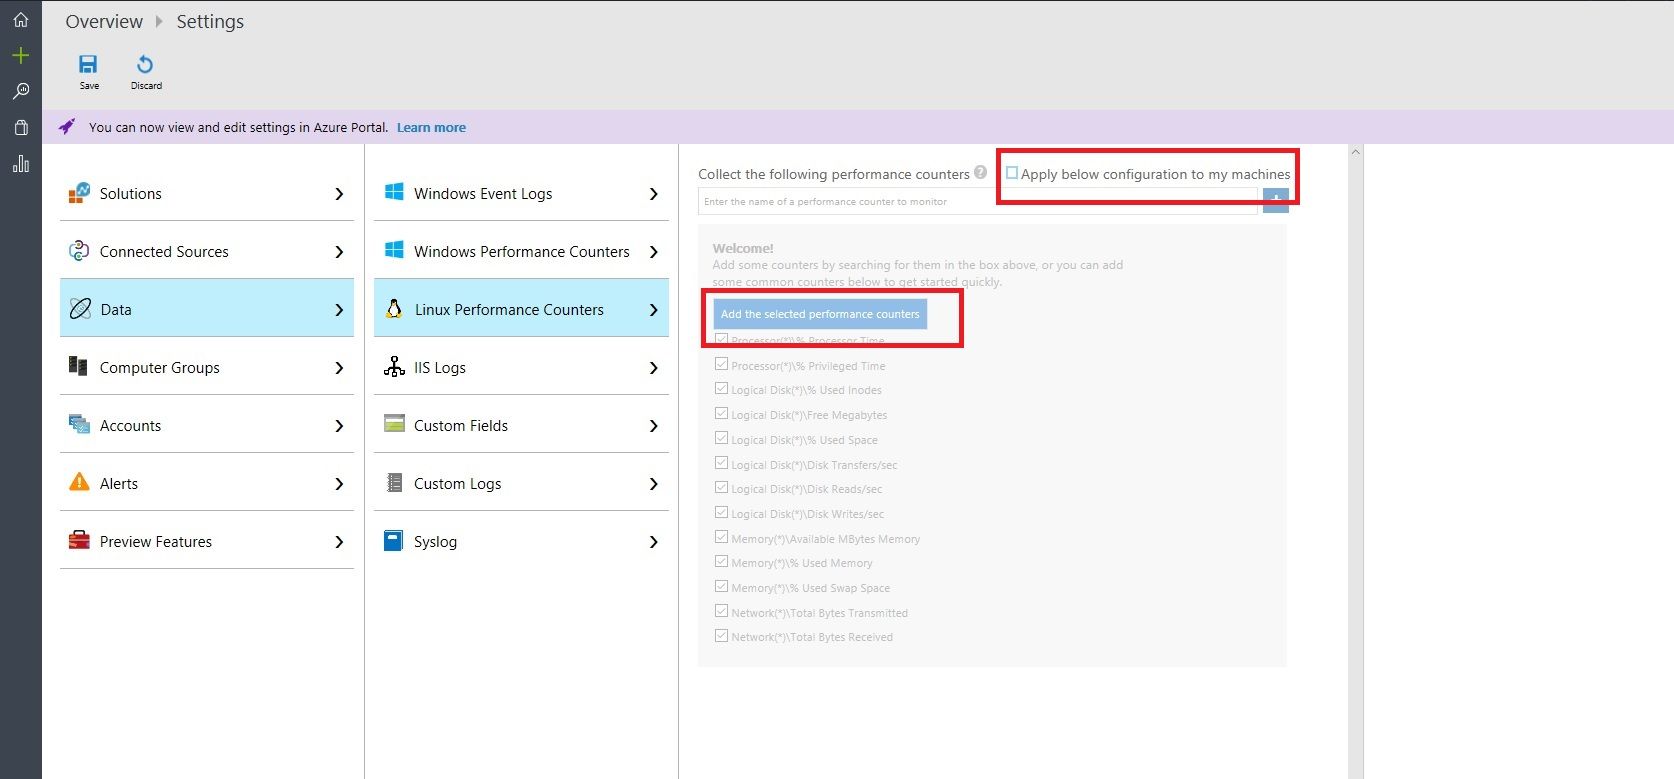
Your environment is now set to collect those performance counters from your Windows VMs. To collect data from your Linux VMs click on the "Linux Performance Counters" blade
-
Click on the "Apply below configuration to my machines" and then select the "Add the selected performance counters"
-
Again set your collection interval time and save the settings to your environment
Your OMS environment is now set up to collect data from your Windows and Linux VMs, the next step is going about displaying the data you are collecting in a meaningful way.
Display Your Data
Unfortunately there is no out of the box solution to do this however, Microsoft Valuable Professional (MVP) Cameron Fuller has written a server performance solution that can be imported into your OMS environment to display the data you are now collecting. He has made this solution publicly available via the Microsoft TechNet Gallery. To utilise this solution follow these steps:
-
Download Cameron's server performance solution from - https://gallery.technet.microsoft.com/scriptcenter/Server-Performance-3d767ab1
-
Extract the ZIP file onto your local machine
-
Open up your OMS Console
-
Click on the "View Designer" icon down the left hand side (the green plus sign)
-
Now click on Import
-
A box will appear asking you to upload from your computer, browse to the location of your extracted ZIP file and select the "Server Performance - with new query language.omsview" file
-
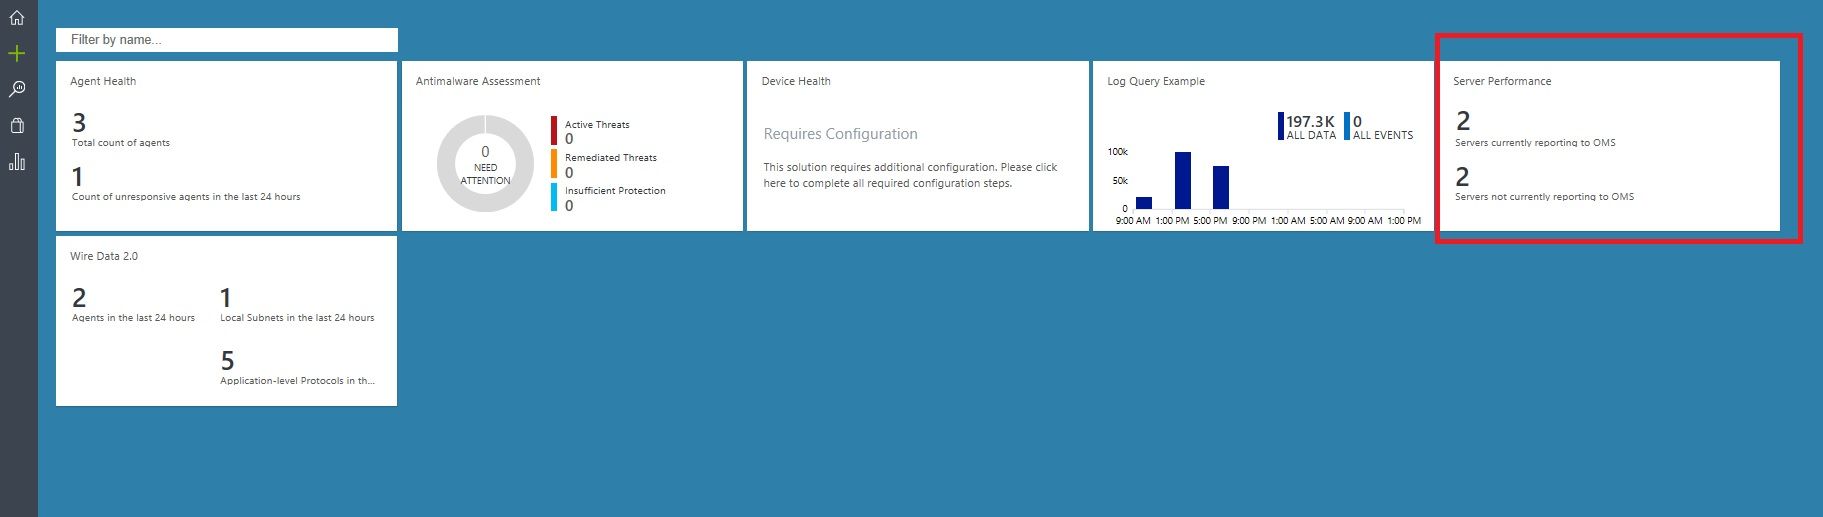
The file will upload and you will start to see tiles populate within the Overview Title and View Dashboard sections, ensure you click on the Save button

-
When you now go back to your OMS Dashboard view you will see a tile called "Server Performance"
-
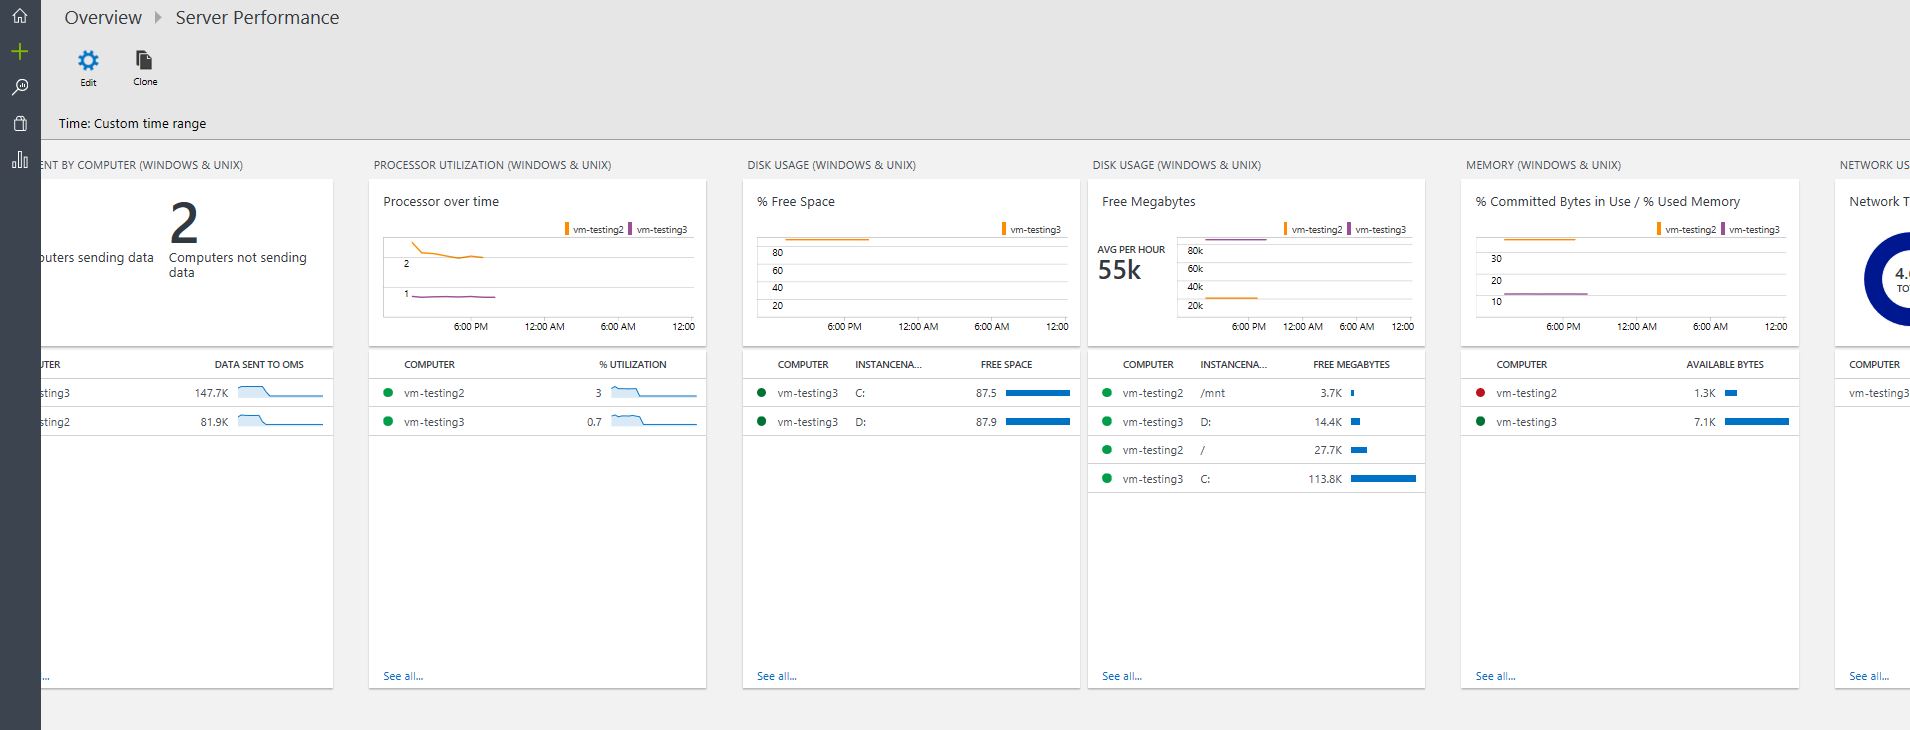
If you click on this tile it will give you detailed view of metrics such as CPU usage, Disk Usage, Memory and Network Usage
Summary
Hopefully the above helps you to start keeping track of some basic metrics from your VMs within the OMS product. The above solution might not fit all your specific needs but it should give you a good base to start from and build on. As always if you have any questions or thoughts please reach out to me via the comments or on Twitter @TechieLass